
The problem with writing about things that happened in the past and being a journalist is that I end up sounding like John Mulaney describing the plot of Home Alone 2: “I know it’s kind of stupid to complain about a movie that came out 17 years ago. But I wasn’t a comedian then, so I have to do it now.”
It’s municipal election season, and it’s probably a good idea to look back at the data from the 2011 election. A couple problems though: first, three years ago I was running UBC’s student newspaper, where my contribution was commissioning a front page illustration of Gregor Robertson and Suzanne Anton and blathering on about UBC’s lack of municipal representation.
Second, while I’d like to retroactively do analysis of that election now, it was mostly covered (especially on the mayoral level) at the time, because people usually don’t wait until the next election to talk about the old one.
But! One thing from 2011 hasn’t been covered to death, and that’s the vote breakdown for council. It’s relevant because:
- All 10 councillors are running for re-election. It’s conceivable they could all be reelected, which has never happened in Vancouver’s modern history
- There are lots of new candidates trying to supplant them, each with different regional pockets of support
- There were large variances in where winners got support in 2011, even with candidates from the same party
Plus, there’s the fact that council speculation is arguably more interesting than the mayoral race and has been less pundited to death.
Is that enough reason for me to go into an overly long breakdown? Probably not. But let’s delve in anyway.
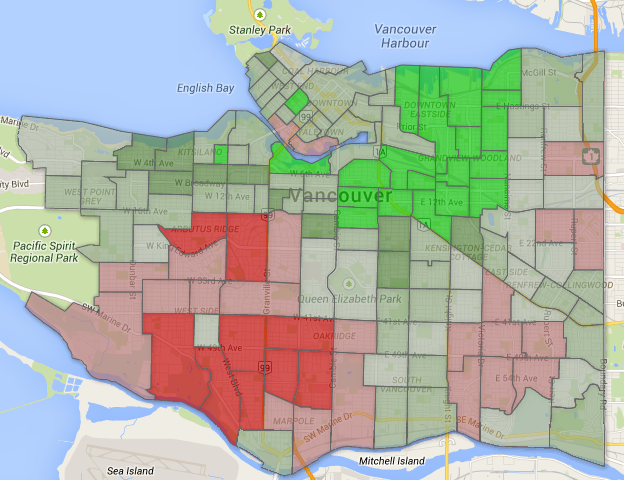
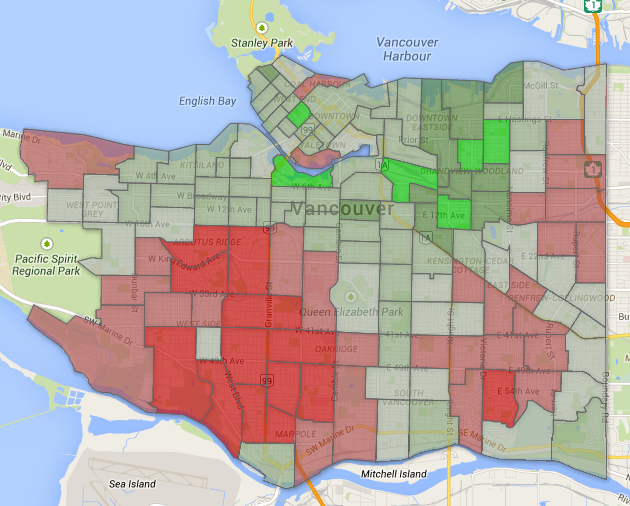
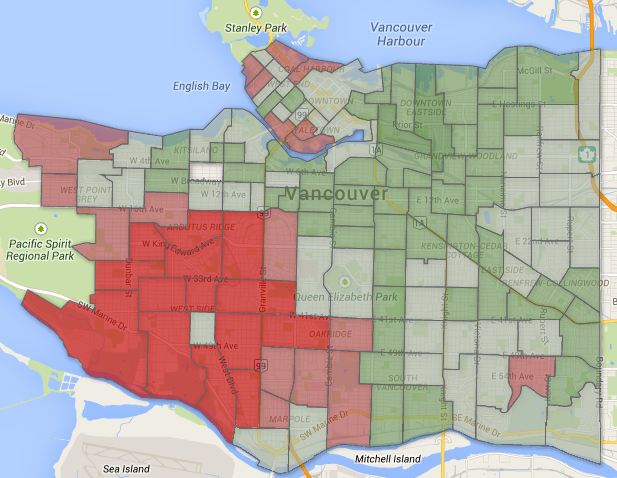
1. Raymond Louie – Vision: 63273 votes (43.69%)
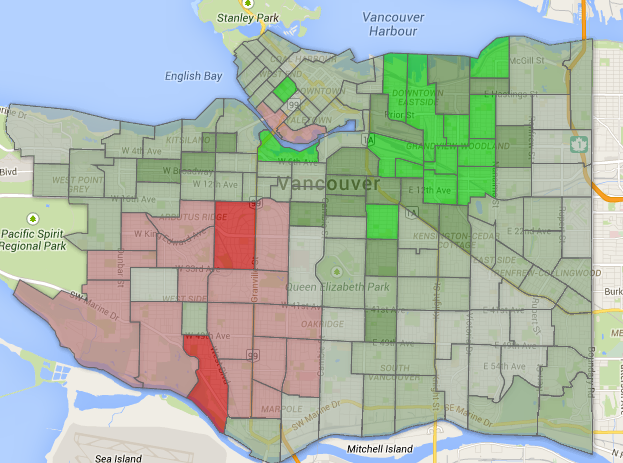
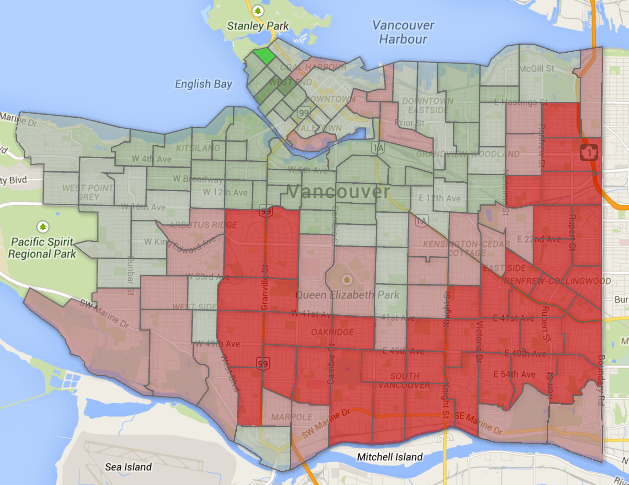
You can view an interactive version here, but for these maps, here’s your basic key.
- Bright green: Over 53.17% of the vote, which is what Gregor got citywide.
- Dark green: Over 50% of the vote
- Light red: Under 33.6% of the vote, which was needed citywide to win
- Dark red: Under 25% of the vote
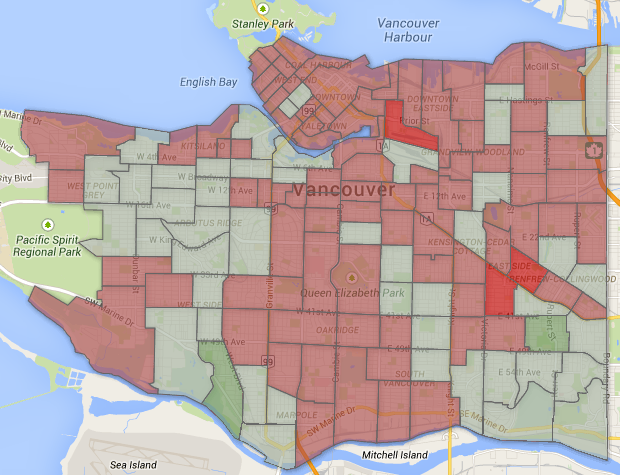
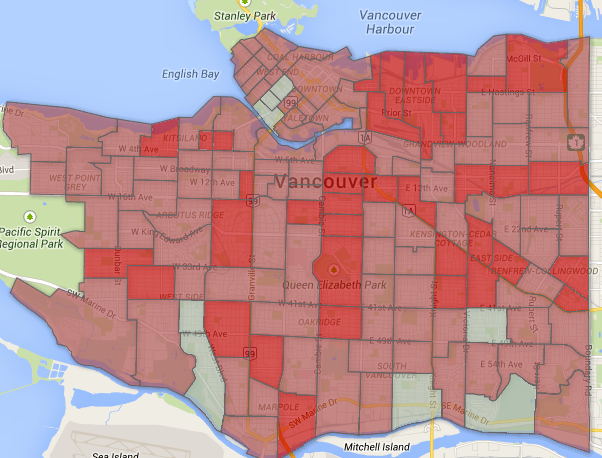
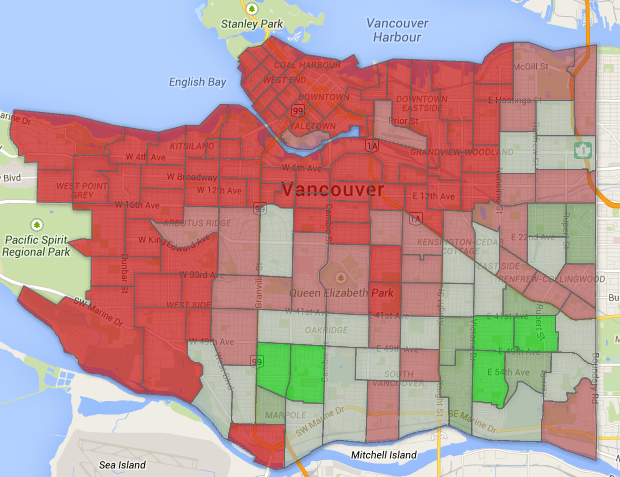
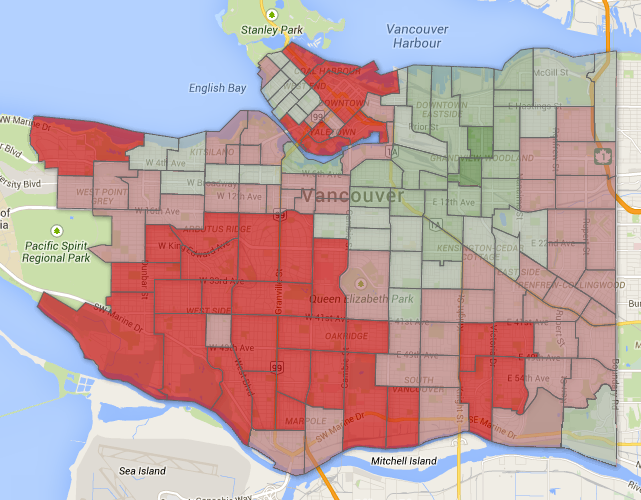
Louie did the best of any Vision councillor not because he was the strongest in their core neighbourhoods (though he did pretty good there), but because he did well in the places his party didn’t, doing quite well in Fraserview and even decent in Dunbar. For a better look at this, here’s a map comparing the number of ballots cast for him compared to Gregor.
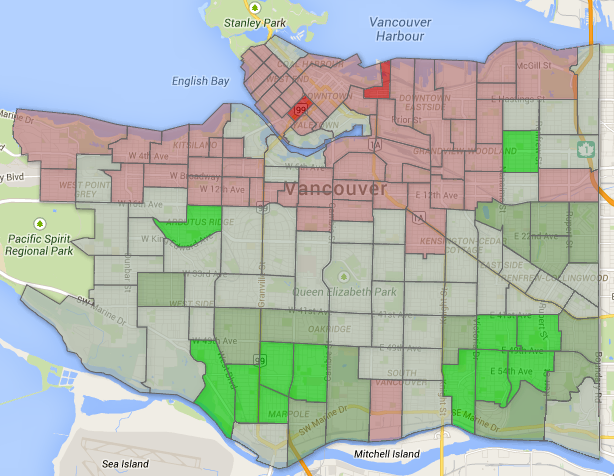
Link here, but again, here’s your basic key:
- Bright green: More votes than Gregor.
- Dark green: At least 90% of Gregor’s vote
- Light red: Under 80% of Gregor’s vote
- Dark red: Under 70% of Gregor’s vote
Louie was Vision’s best performer south of 16th by far, and was more popular than the mayor in Marpole and Fraserview. He was elected with 15,000 votes to spare in 2011. Hard to imagine a scenario where he doesn’t get reelected.
2. Kerry Jang – Vision: 61931 votes (42.76%)
Jang and Louie had pretty much the same distribution of votes last election — Louie just did a little worse in Dunbar and Fraserview. (This isn’t the case for all of Vision! Promise!). His comparison to Gregor:
Full graphic here, but again, much the same as Louie’s—he’s strongest compared to his peers south of the city, specifically in north Marpole/Fraserview.
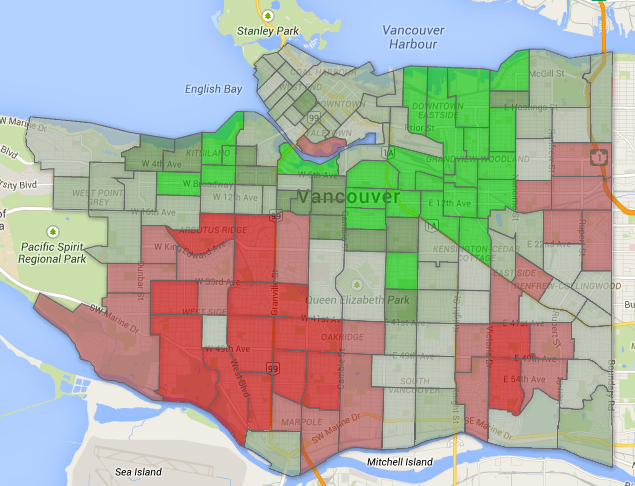
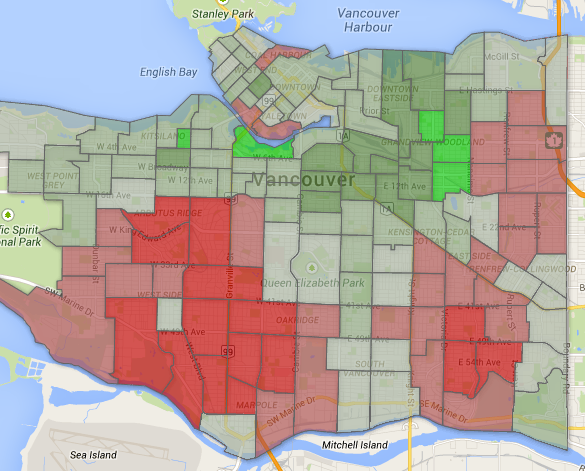
3. Heather Deal – Vision: 61386 votes (42.37%)
Deal is stronger than Louie/Jang in Grandview-Woodlands/DTES and Kits, worse in Marpole/Fraserview and sort of the same everywhere else. It means she quite possible has the broadest name recognition of any Vision councillor, which may be why she the #1 Visioner in a recent Justason survey.
Here’s Deal’s comparison to Robertson, which again shows how she fares comparitively well on the west side of the city.
4. Andrea Reimer – Vision: 60593 votes (41.84%)
Reimer had an interesting breakdown: She topped the polls in 28 stations, more than any other candidate, mostly in Vision strongholds.
At the same time, in the south of the city, there was a noticeable dropoff from Louie/Jang/Deal/Tony Tang to Reimer/Stevenson/Meggs. Here she is compared to Gregor:
Reimer’s breakdown is much the same as Deal—she gets more support in neighbourhoods where Vision has taken more criticism this term. Having said that, she still received 12,000 more votes than 11th place Ellen Woodsworth and has broad enough support that she should be considered safe.
5. Tim Stevenson – Vision: 56638 votes (39.11%)
There’s a larger gap between Stevenson and Reimer than between Reimer and first-place Louie. This map doesn’t show it too well, but you can see that Dunbar/Oakridge are getting progressively darker, as Stevenson struggles to get on the ballot outside of core Vision areas.
This comparison with Robertson makes it more stark—outside of the West End, there aren’t a lot of places where Stevenson was strong, though his strong name recognition gives him a better base than Meggs or Tang.
6. Geoff Meggs – Vision: 56184 votes (38.74%)
Meggs does well in traditional Vision areas, along with West Point Grey (he got more votes than any other Visioner in the uber wealthy station north of 4th), but languishes in the 15-20% range in Shaughnessy/Marpole/Fraserview along with Stevenson.
As the Gregor comparison shows, Meggs is probably the most “west of Granville” candidate Vision had last election, which doesn’t bode well when you consider that’s where the density debate is increasingly happening.
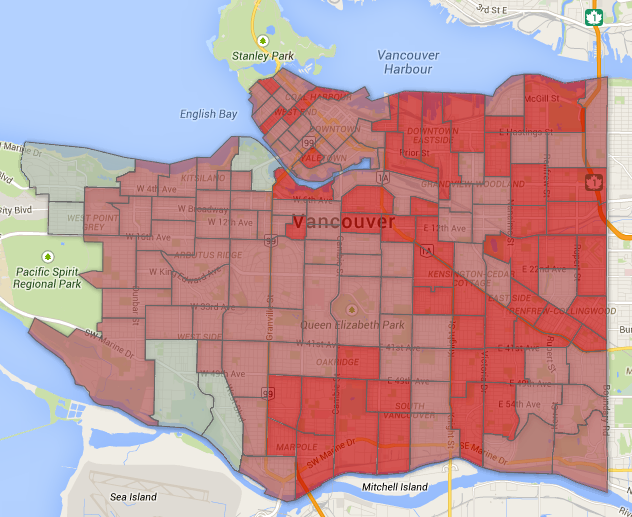
7. Tony Tang – Vision: 53,873 votes (38.74%)
Tang was the only Vision candidate running last time who wasn’t an incumbent, and it’s clear his lack of name recognition hurt on the westside.
However, he did much better in the immigrant-heavy neighbourhoods in the southeast of the city, as the Gregor comparison map makes clear…
This is why I’m skeptical Tang is in as much trouble as the Justason poll, which put him at 15% support, suggests. An online panel survey of 327 people will struggle to be truly representative. In 2011 Tang received 38.74%, despite limited name recognition, because he got Louie/Tang levels of votes in Fraserview and north Marpole.
Of course, we don’t know where Tang was internally “ranked” by those casting ballots for him last time, and he wasn’t the #1 choice in any one polling station…but there’s reason to believe he isn’t the most vulnerable Vision councillor, when you consider his vote breakdown relative to Meggs and Stevenson.
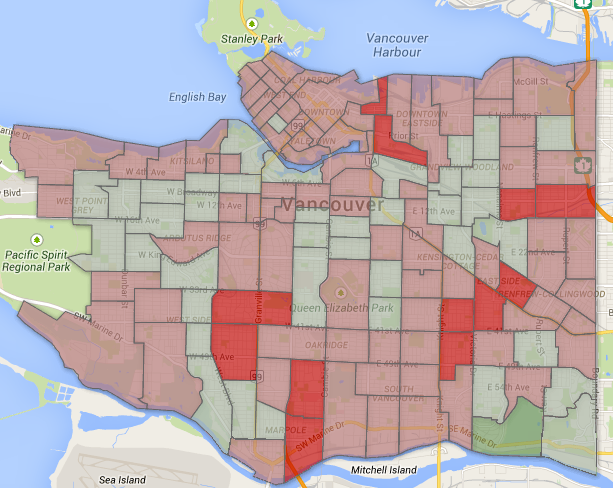
8/9. Elizabeth Ball & George Affleck – NPA: 51607/51145 votes (35.63/35.32%)
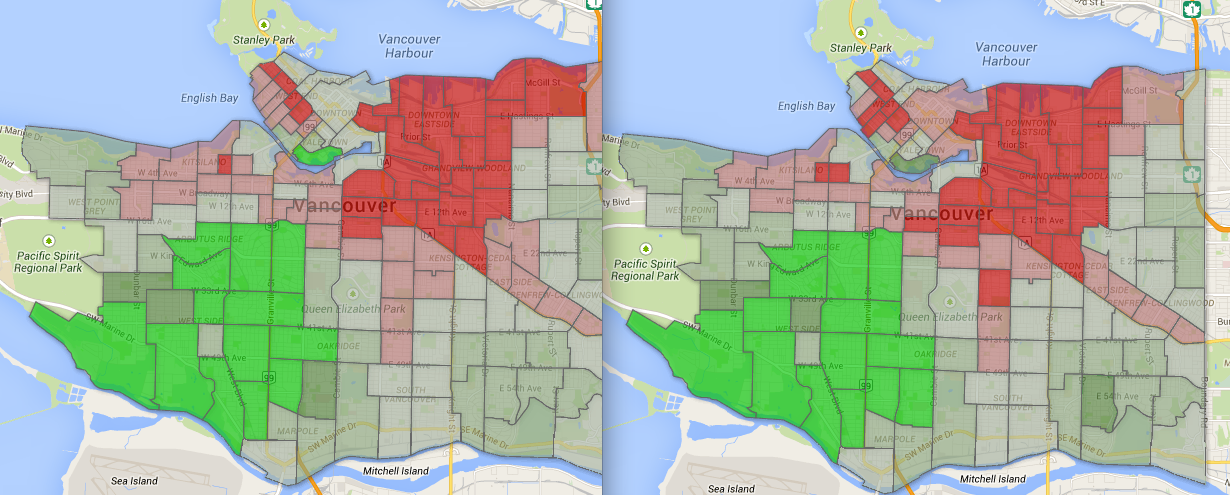
Affleck is on the left, Ball is on the right, and we’re going to go through them quickly because they both had the same path to getting a seat on council: Sweep up the westside south of 16th, do decently in Fraserview/Killarney, and do just well enough in Kits/West Point Grey (Affleck did much better than Ball in the area surrounding False Creek, Ball did slightly better pretty much everywhere else, in case you’re wondering). Other NPA candidates failed to dominate in the westside, like Sean Bickerton being just one example…
Of course, one problem for all NPA candidates was the giant swaths of Mt. Pleasant, DTES and Grandview-Woodlands where none of their candidates were able to get even 25% of the vote. If that continues this time, than the Ball/Affleck route may be the only route available for NPA candidates—although the extra COPE/Green candidates in Kits and West Point Grey could make NPA gains a dicey proposition.
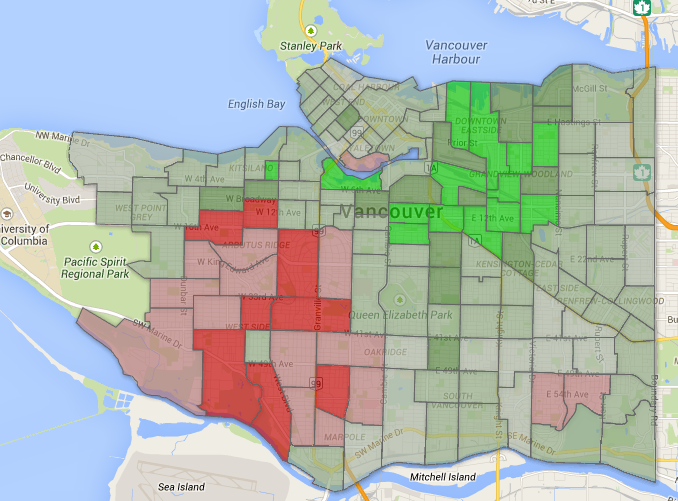
10. Adriane Carr – Green: 48648 votes (38.74%)
Carr of course was the only Green council candidate last election, and this time is being joined by Cleta Brown and Pete Fry, so it’s interesting to see where her support came from. Carr had more votes than anyone else in the West End (though Tim Stevenson has a case if you have an expansion interpretation of the neighbourhood boundaries), along with healthy support north of 16th and a decent amount of votes in Dunbar.
Most pundits seem to think Carr will be reelected. The big question is whether people who voted for Carr this time will also vote for Fry and Brown—and if they do, what names will they knock off the ballot?
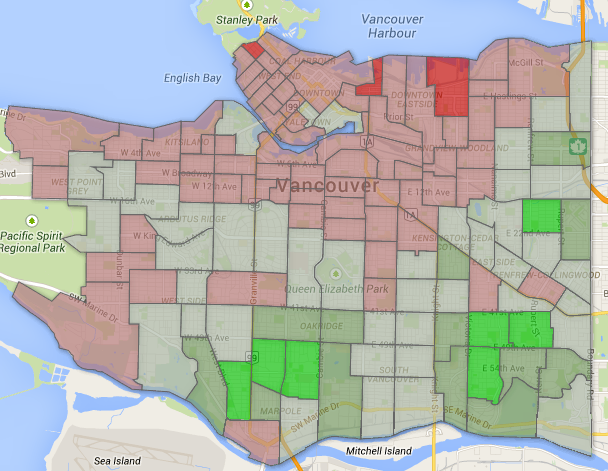
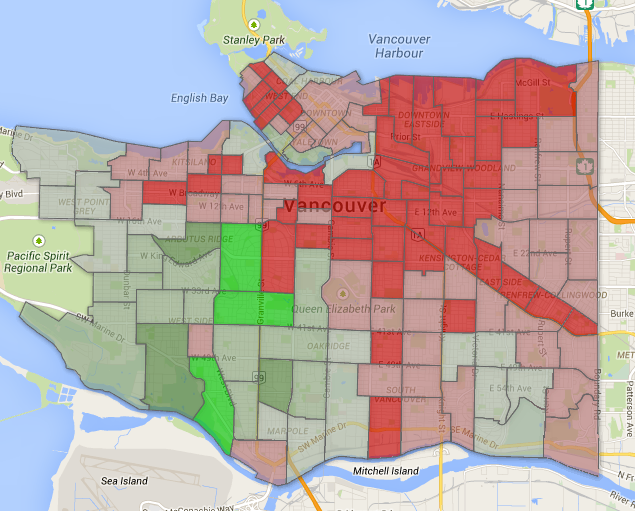
17. Tim Louis – COPE: 43926 votes (30.33%)
Choosing any of the three COPE candidates from 2011 as representative of the party today is tricky because of their move further to the left—Woodsworth isn’t running, Aquino left the party and Louis had to fight to remain party co-chair this summer.
But as Louise is one of seven candidates the party is running this election, let’s use him. Strong in Grandview-Woodlands, the DTES and the West End, competitive in Kits and Kensington, and struggling everywhere else. Louis was 4800 votes short last election, and those votes could be had a number of ways. But will they?
Would a ward system be any better?
Of course, one of the reasons these comparisons are so complex is that Vancouver doesn’t have a ward system, making it somewhat of an anomaly in Canada. But if Vancouver did have a ward system, what would the current council look like?
Not a whole lot different, actually. Here’s the experiment I did: Vancouver has 11 provincial electoral districts. What if we transposed those boundaries on votes for council last election?
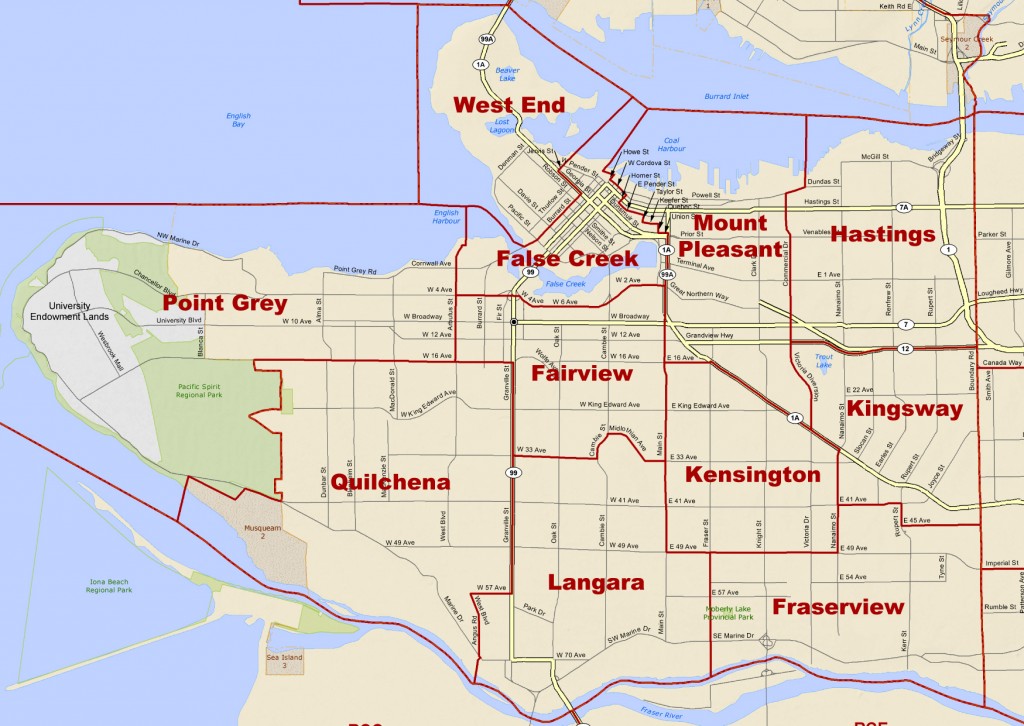
A couple caveats: I counted six polling stations (of 135) that resided in two ridings, advance voting isn’t included, and UBC isn’t part of Vancouver, so the Point Grey riding is about 20% smaller. Having said that…
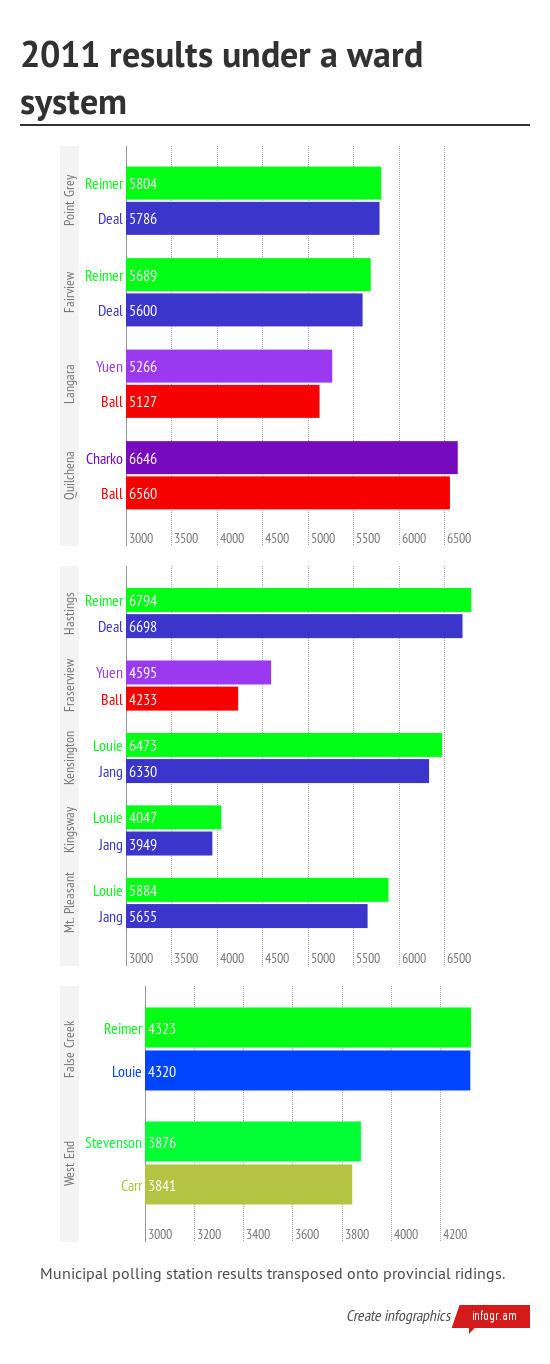
You’d have 7 Vision councillors, 3 NPA councillors (with Affleck replaced by Charko and Bill Yuen), and Stevenson and Carr have a tossup for the West End riding.
Of course, all that is literally three-year-old news. A new election is next week—and that can only mean new, updated charts in the weeks to come! Won’t that be fun?
Categories: Uncategorized
