
Hey! Remember when this novelty blog was the only place where I could post overly long, wonky looks into the minutiae of electoral politics, with charts and maps and meaningless gifs in a desperate attempt to prove my worth as a young journalist, which, though successful, resulted in many nights where I only slept for five hours because of overworking myself?
Let’s go back to that!
We just got the detailed results of Vancouver’s municipal election, polling station by polling station, and like any sane person, I spent my Saturday going through it all manually, seeing if there was anything worth noting.
And, dear reader, there is. So let’s get to it!
1. Where did each mayoral candidate get the most support?
Answer: pretty much exactly where you would expect. Ken Sim (red) won Point Grey/Coal Harbour and nearly everything south of 16th and west of Kingsway, Shauna Sylvester (yellow) won Kitsilano and south False Creek, and Kennedy Stewart (green) won everything else.
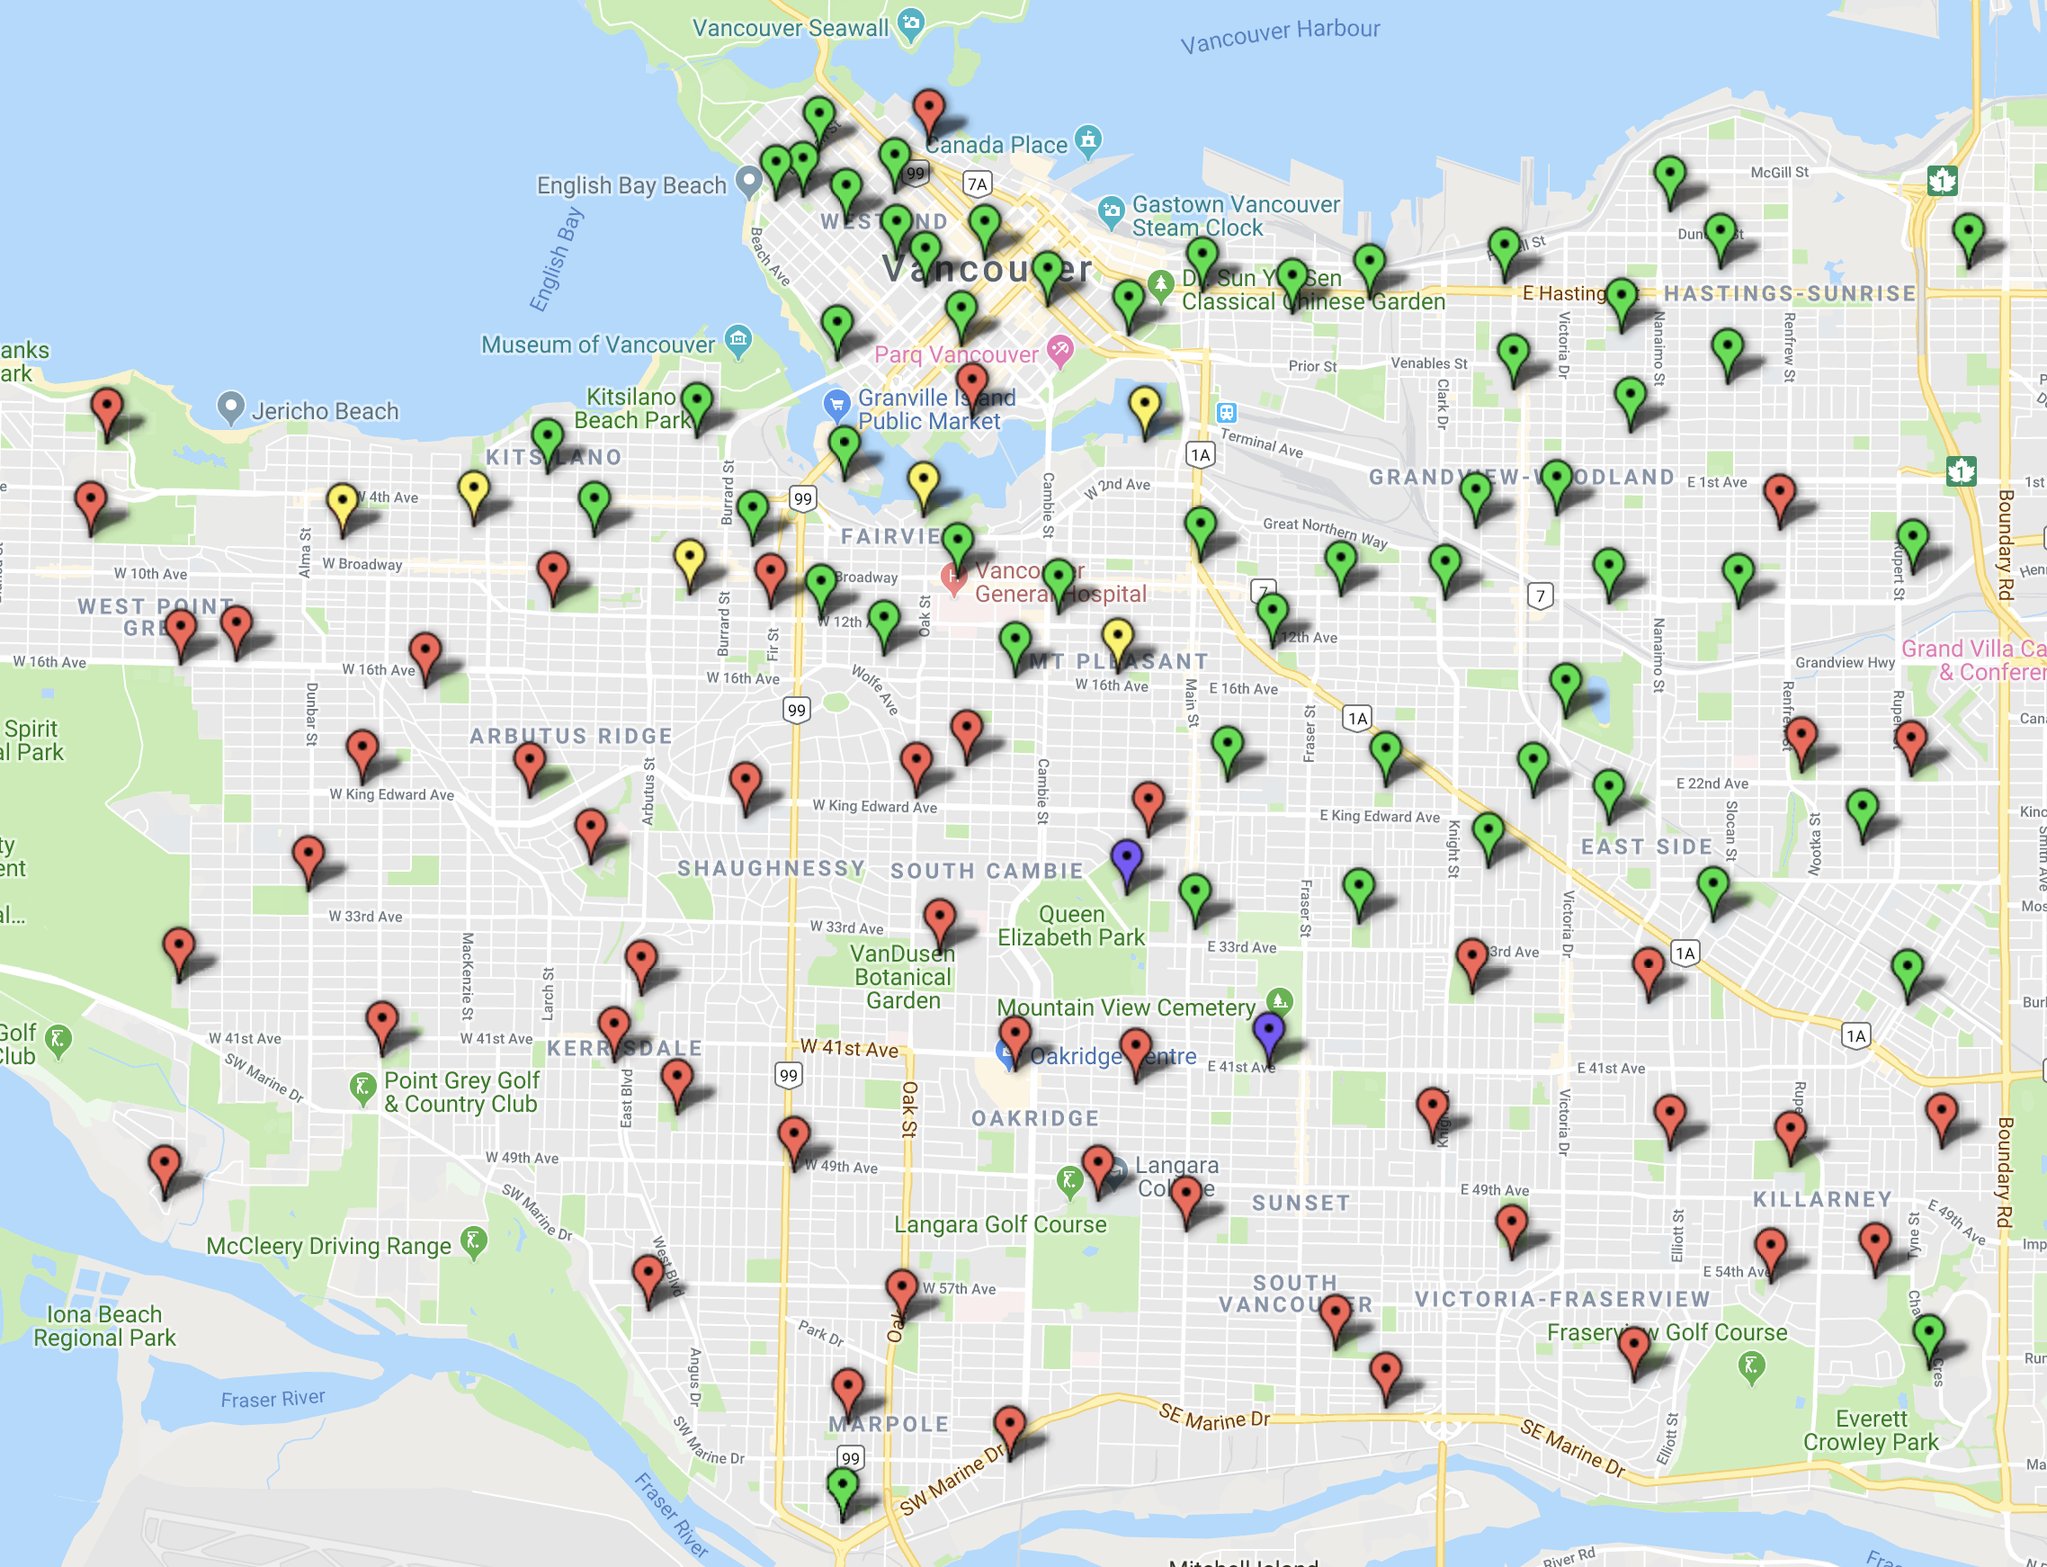
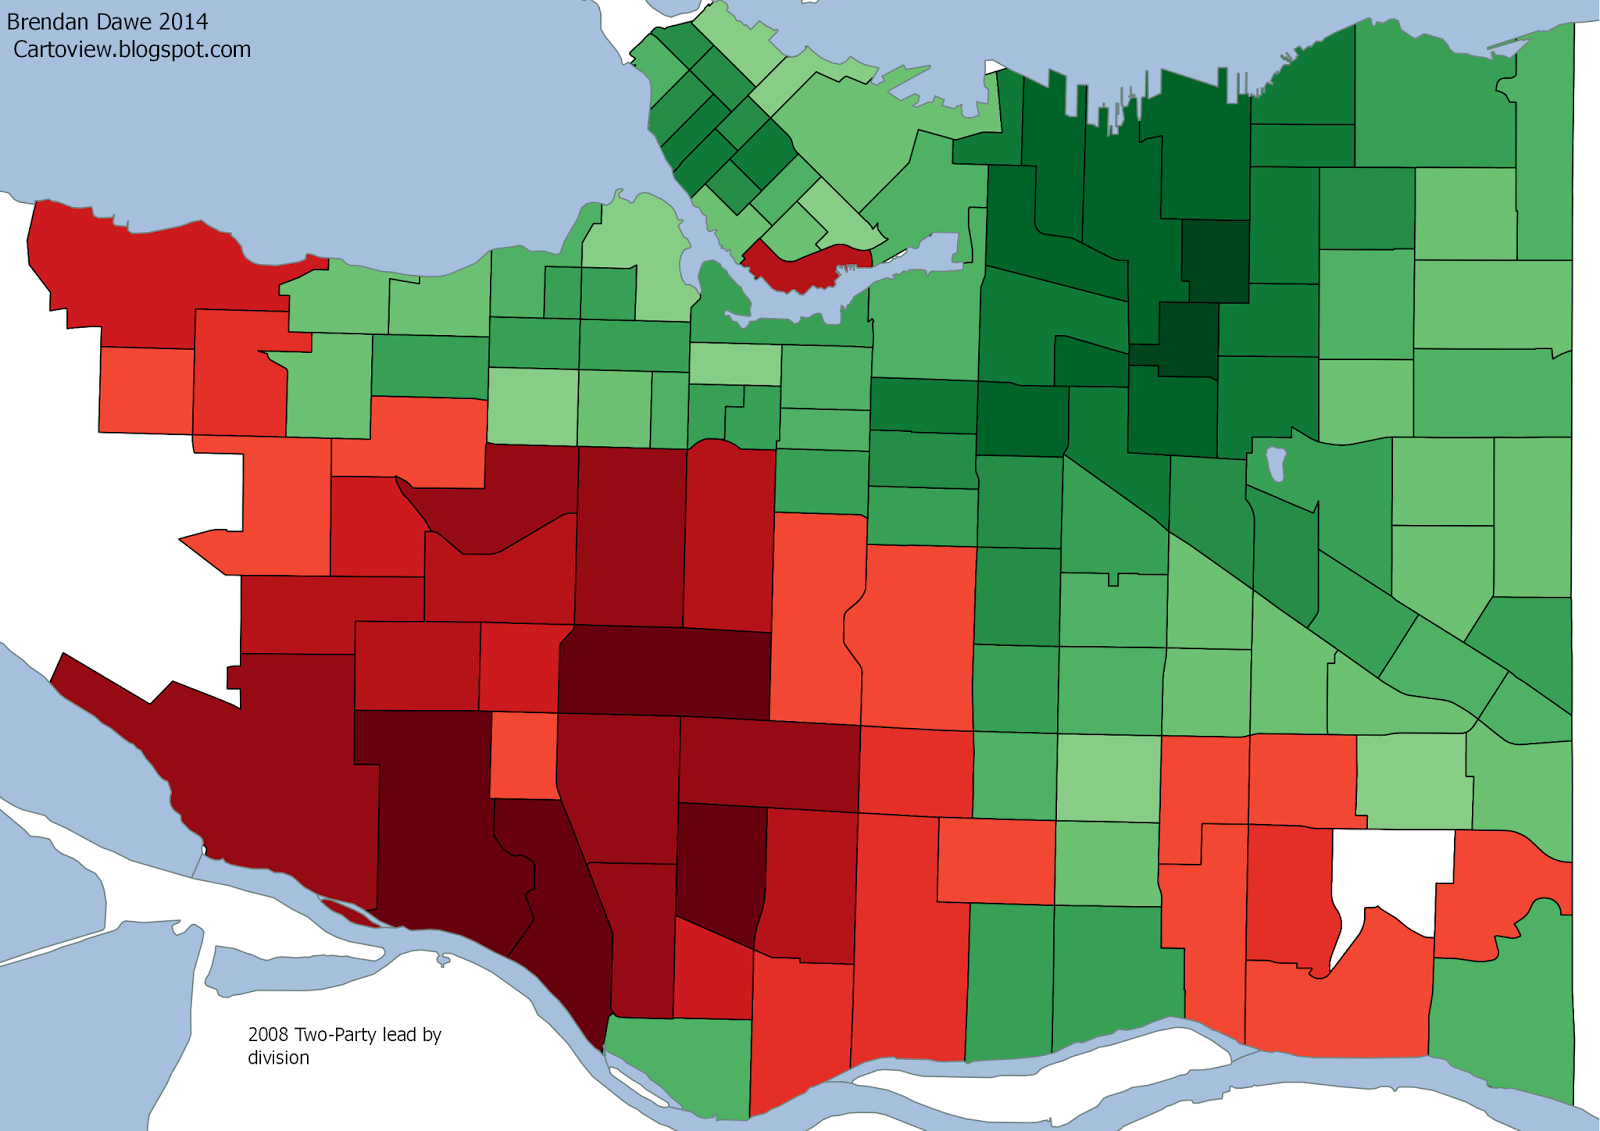
Link to the map here. It’s hard to do exact historical comparisons, because people can now vote at any polling station they like instead of one tied to their address (this change happened last election), but look at the 2008 election, for example — the breakdown between the NPA candidate and the non-NPA candidate is pretty much the same.
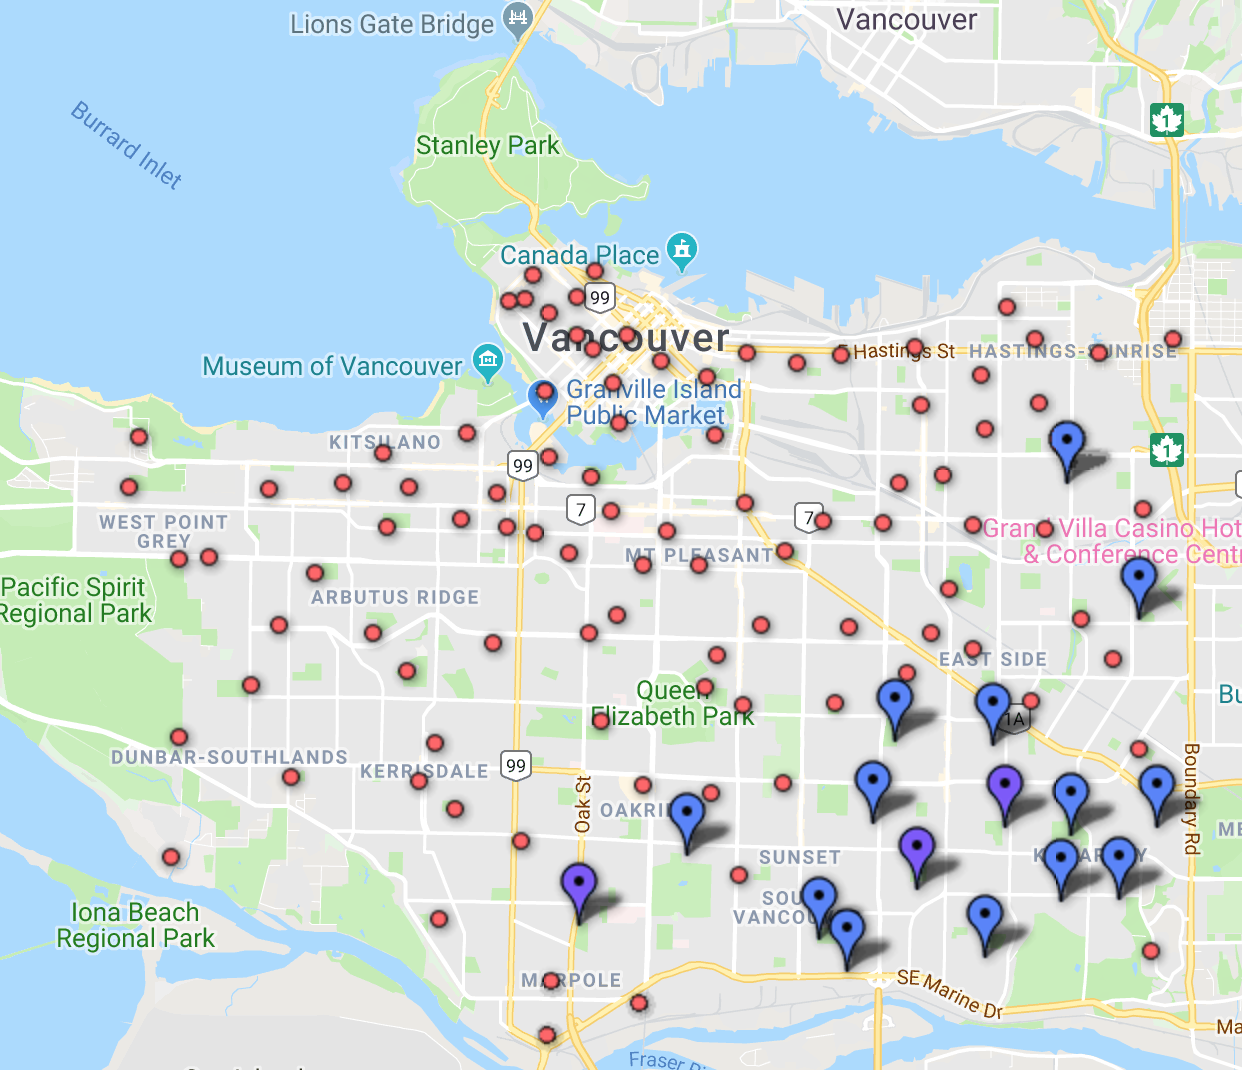
But there are a couple other things that jumped out at me. First, you’ll notice that Wai Young isn’t anywhere to be seen on this map — despite a lot speculation from certain older pundits I’m not going to name that she could be a force in the election, she didn’t win a single polling station and only was a top-3 choice in a few places in the southeast corner of the city, as this map shows (purple = 2nd place, blue = 3rd place).
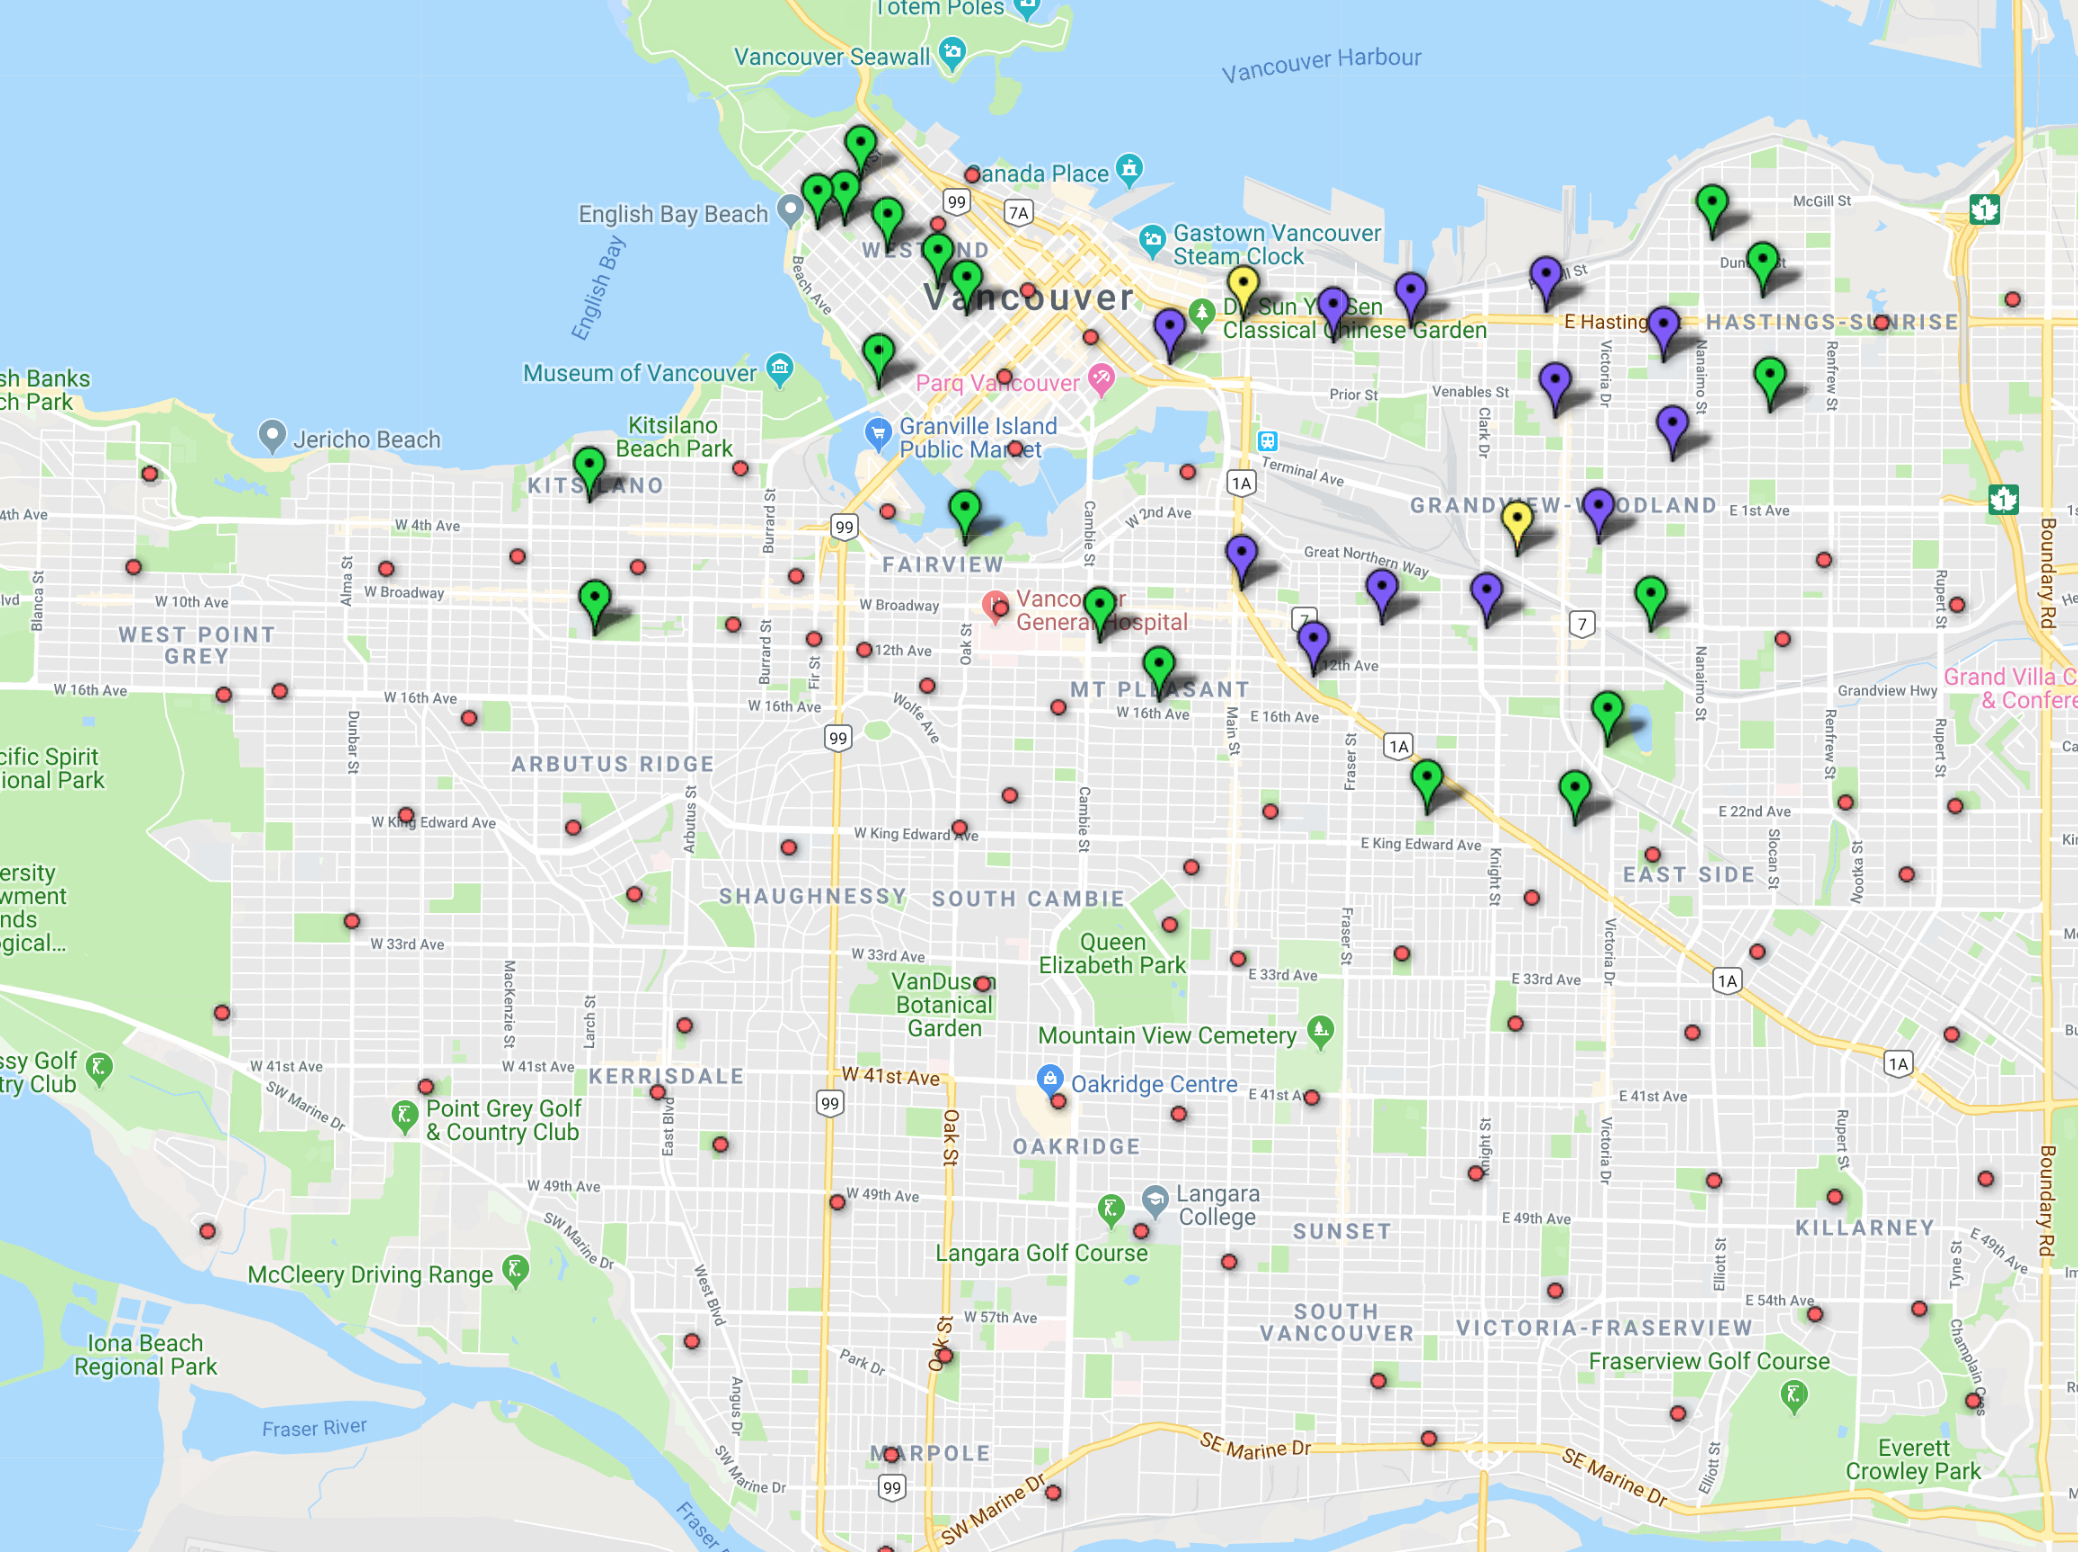
However, if we extend this exercise of charting 2nd place finishes to the main candidates, we can see one of the reasons Kennedy Stewart won: he got support pretty much everywhere. He are three maps, showing where the main candidates finished either first or second.
Sim lacked support in Kits, the West End and Grandview-Woodlands. Sylvester lacked support south of King Edward. But Stewart got a decent percentage of the vote pretty much everywhere except Shaughnessy and Dunbar — so even though Sim had around 10 polling stations where he got over 50 per cent of the vote and Stewart had none, the former NDP MP was able to pull if off.
2. Which council candidates got the most support at each polling station?
Adriane Carr received 8,000 more votes than her nearest competitor, fellow Green Party candidate Pete Fry, so you would expect her to dominate this list.
And, quelle suprise, she does, being the top vote getter at nearly half the polling stations in the city, and finishing in the top 10 in 120/123 locations.
Link to the map here. Carr wins 55 stations, including the West End, Hastings-Sunrise, Riley Park, and the only places I travelled as a UBC student pretty much everything north of 16th and west of Main Street.
Meanwhile, the places where fellow Green Pete Fry got more votes than Carr (15 stations in total) pretty much form a circle around the railway yards (Strathcona, DTES, Grandview-Woodlands, Mt. Pleasant) which is both interesting from a socioeconomic perspective, but also something that amuses me graphically, and will tempt me into calling him “King of the Railyards” for the next four years.
ANYWAY. De Genova, being the only NPA incumbent, unsurprisingly got the most votes in traditional NPA strongholds (30 polling stations in total).
But the most interesting thing, to my mind, is NPA candidate David Grewal winning all four polling stations around Sunset, but finishing in 11th place overall, 1,600 votes out of winning a council spot.
The data comes after several weeks of a city-wide discussion about the lack of diversity on council, a renewed lamentation on the fact Vancouver has never had a councillor of Punjabi ancestry, and a debate over whether ward systems would change that imbalance.
Do with it what you will.
(As for those not mentioned, Swanson topped Carnegie Centre and Grandview Elementary School, Jojo Quimpo got Collingwood neighbourhood house, Lis Dominato won Shaughnessy Elementary, and Wade Grant got the most votes at the Musqueam Community Centre)
3. There are NPA polling stations, and there are Green/COPE polling stations
Now things get really interesting if you’re a nerd.
Between election day and advanced voting, the city counts 123 polling stations.
And when it came to which 10 candidates got the most votes, over 75% of them followed the same pattern: either 7-8 of them were from the block of 8 NPA candidates, or 6-7 were candidates from the block of 7 Green/COPE candidates.
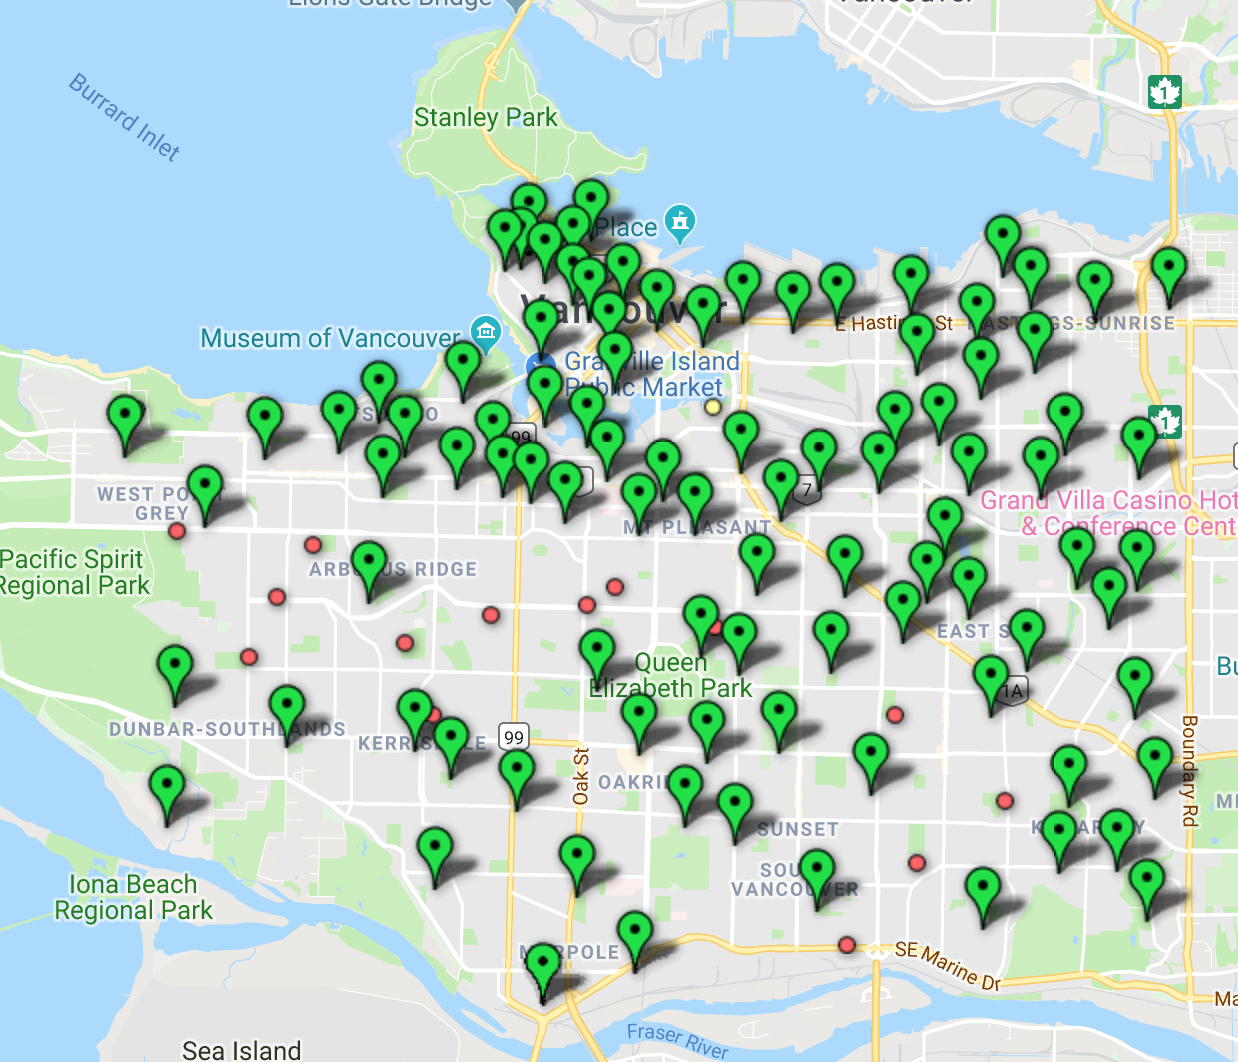
First, here’s the places where all 7 Green and COPE candidates were in the top 10, AND the other candidates in the top 10 were from Vision/OneCity/independent progressives.
The places are sort of where you would expect, but there was incredible consistency in these 33 stations for the people that filled the non-COPE/Green spots in the Top 10: Christine Boyle was on all 33 (usually in the top 5 vote-getters), Brandon Yan was on 30, Heather Deal was on 26, Sarah Blyth was on 7, and no other progressive made it to the top 10 more than once (and unsurprisingly, Stewart or Sylvester were the leading mayoral choice at each one).
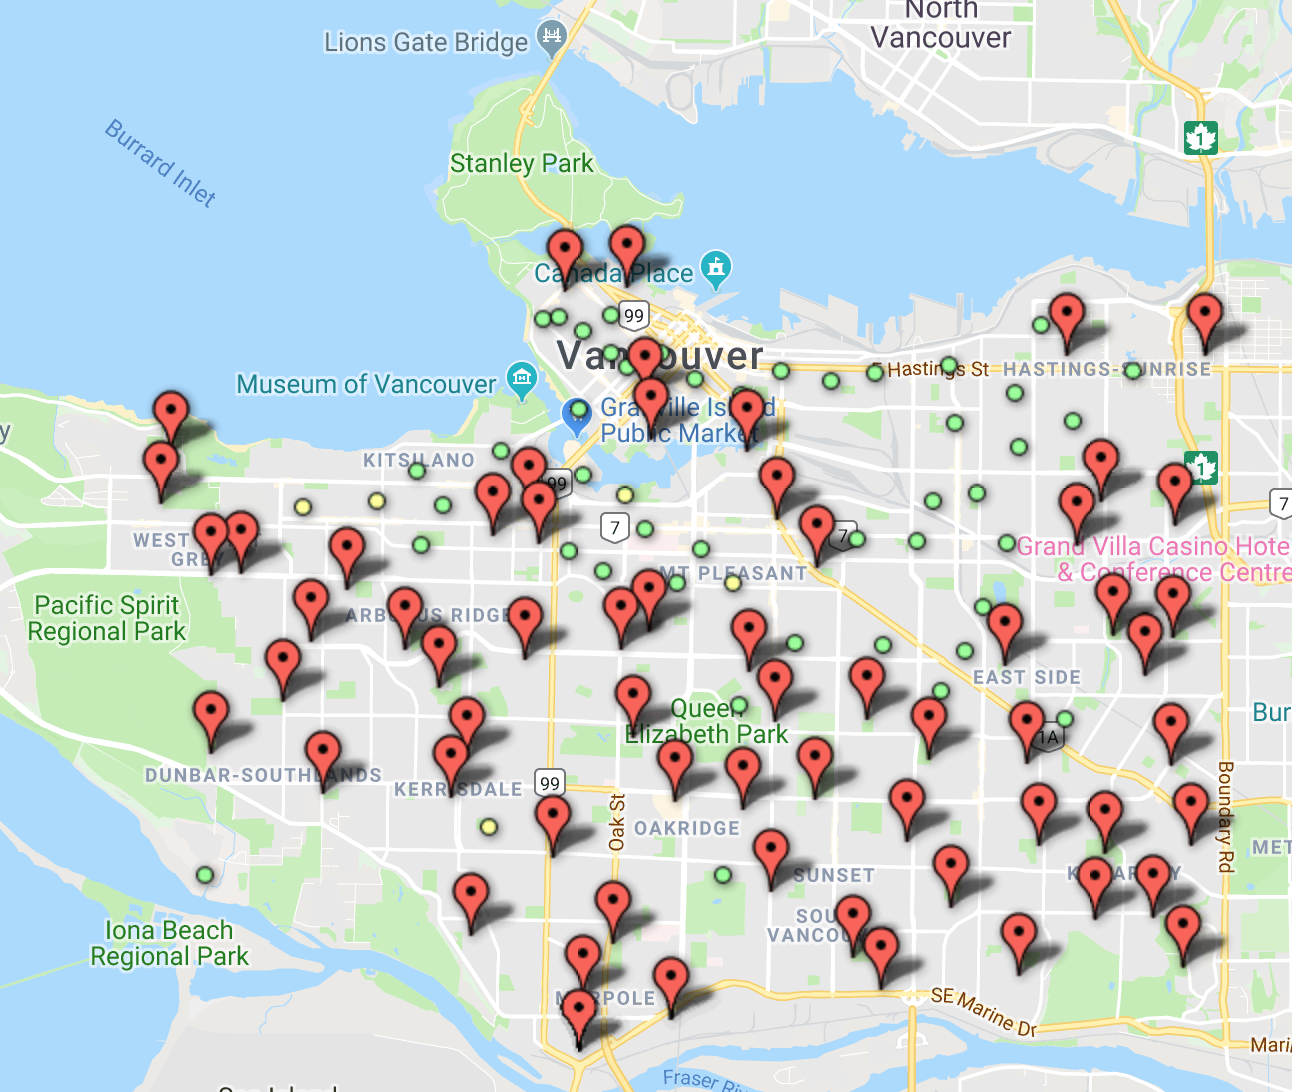
Next, let’s take a look at the NPA vote. With eight council candidates, people wondered how many voters would choose them all as a block, particularly on the west side of the city. The answer?
It’s sort of amazing how perfectly diagonal that line is, stretching from Point Grey and going all the way down to Fraserview (oh, and Coal Harbour. Can’t forget about them!).
And also, note how in Shaughnessy, Kerrisdale and Southlands the eight NPA council candidates were 1 through 8 on the vote-getting list (the markers in red). A lot of time was spent this campaign wondering if the NPA would lose their influence among older, wealthier voters in this city — but that base continues to be incredibly stable for them.
But there’s another voter coalition in Vancouver we can talk about — the GreenPA block.
There are (generally) two prevailing theories about why the Vancouver Green Party is so popular: the first is that they’re an environmentally-responsible yet pragmatic party, one that cares about listening to residents but also moving the city forward in a progressive way. A median voter sweet spot, if you will.
The second theory is (pundit cap on!) Adriane Carr has so consistently opposed new developments/changes to single-family neighbourhoods over the past seven years that property owners who don’t consider themselves left-wing are big fans of the Greens, while voters who aren’t super engaged politically outside of elections but consider themselves, to quote Premier John Horgan, “woke” (i’m so sorry), vote for the Greens out of habit.
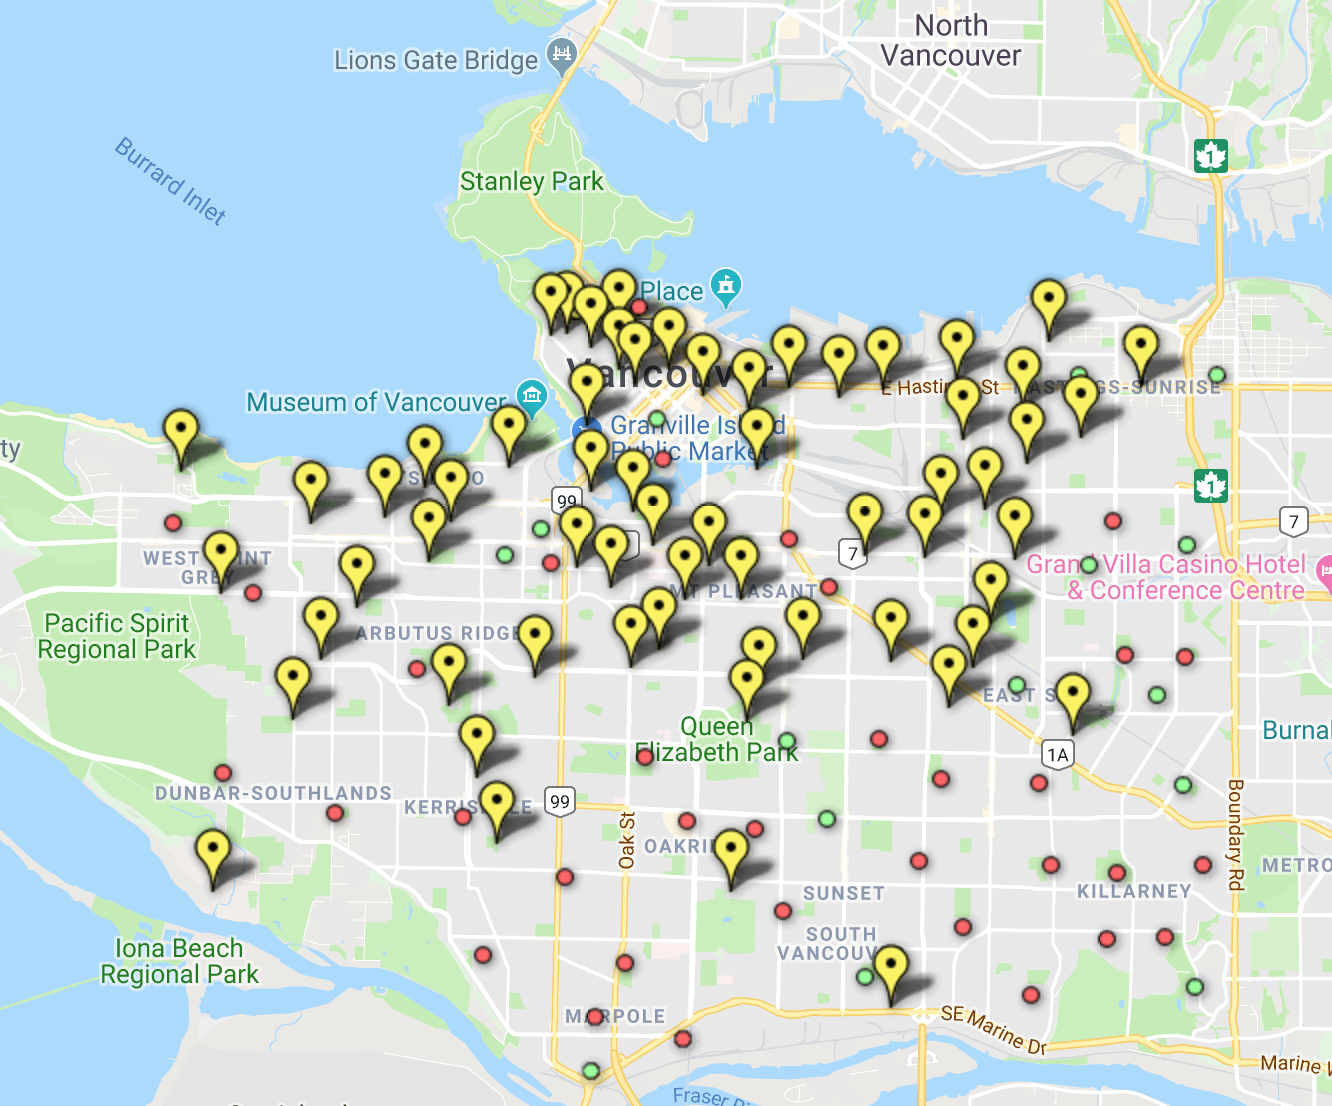
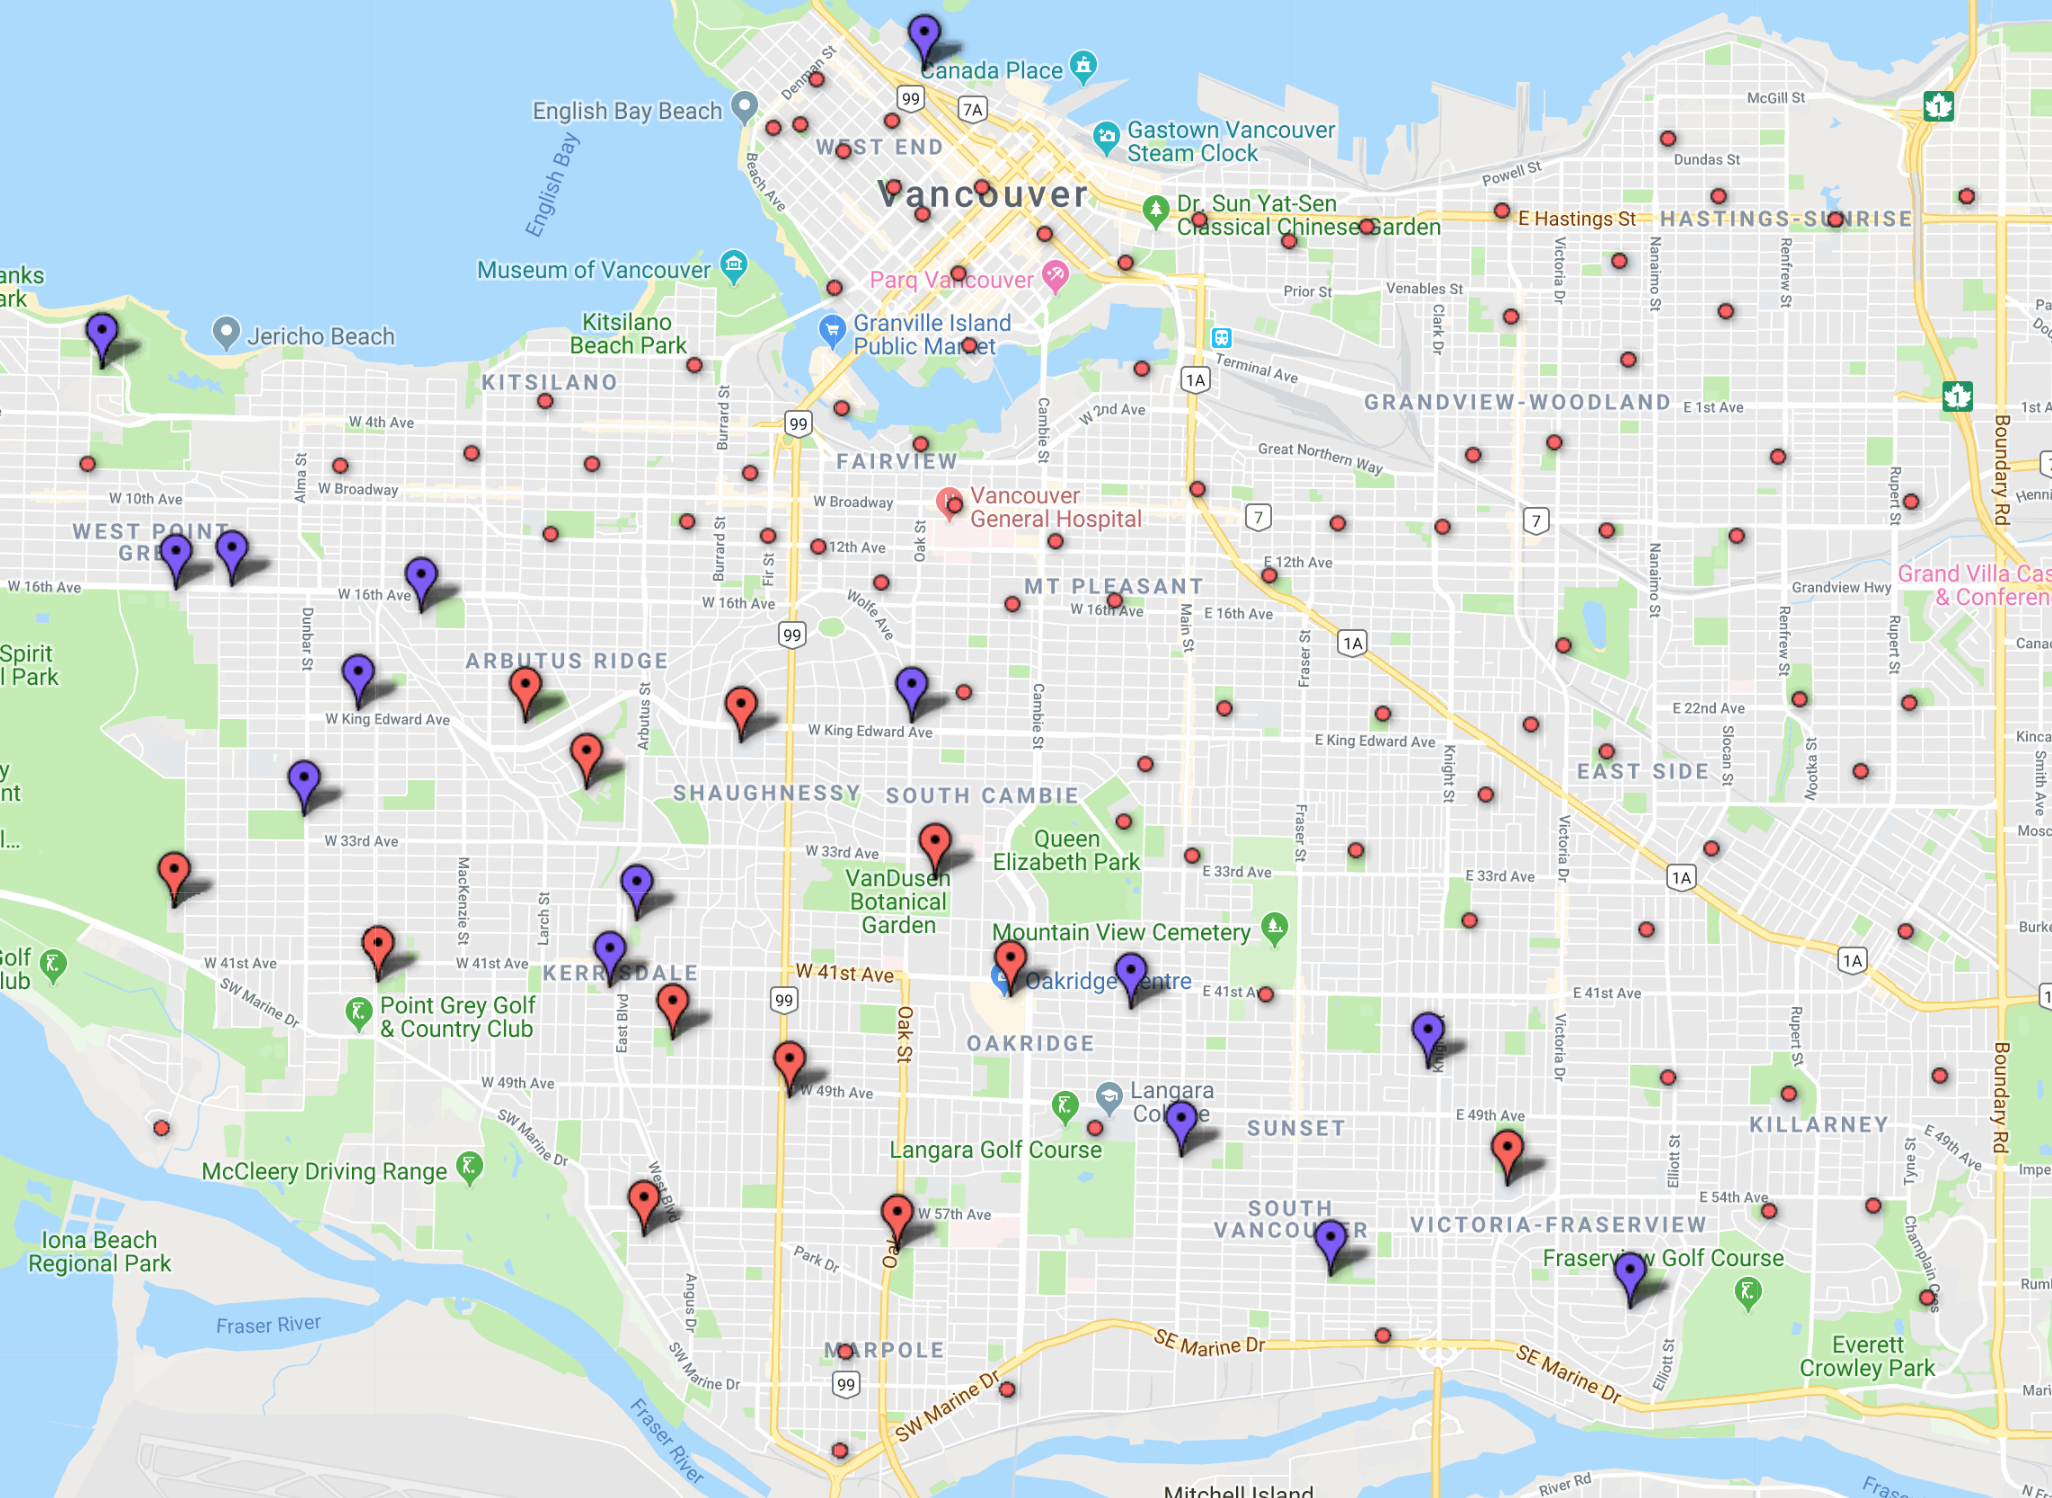
There is probably some truth to both theories! But I’ve rambled long enough. Siri, show me polling stations where Ken Sim got the most votes and at least six NPA council candidates were in the top 10 — but so were Adriane Carr AND Pete Fry.
There were some areas (west Shaughnessy, Sunset, Fraserview) where it seems more voters filled out their ballot with Erin Shum, or a Coalition Vancouver/Vancouver 1st candidate, instead of a Green.
But for the most part, the Green brand was strong enough in traditional NPA territories to help Carr and Fry (and Wiebe, to a much lesser extent) on their way to victory.
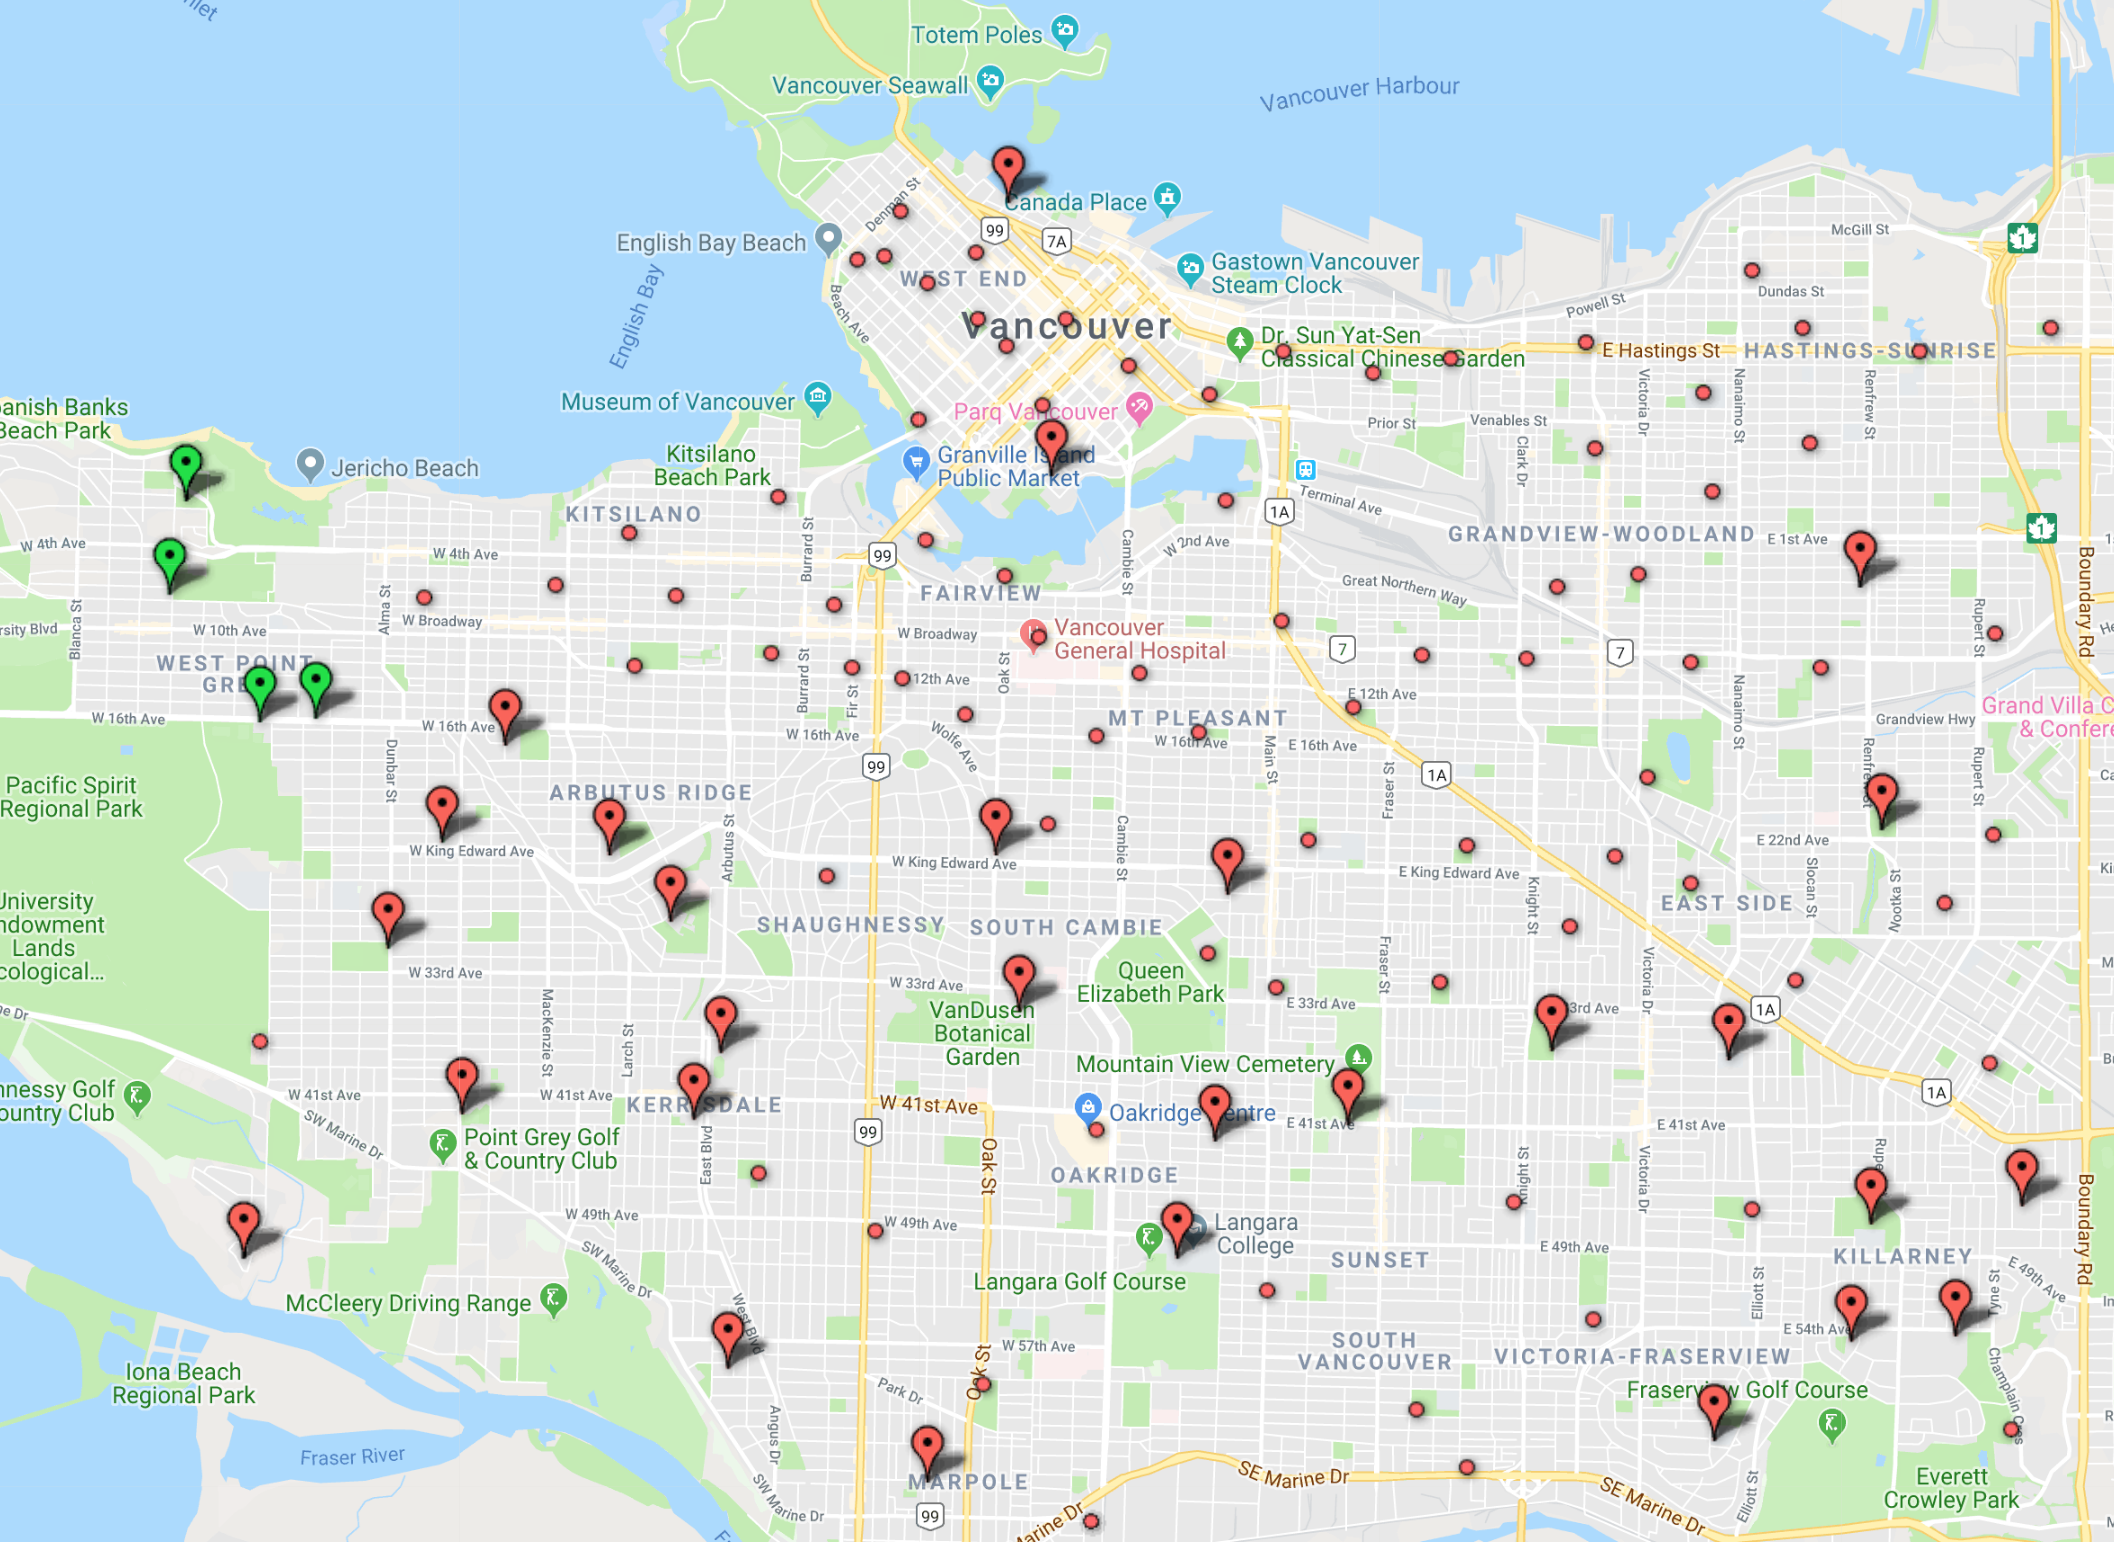
Also, you see those four green markers in Point Grey?
Those are the polling stations where Ken Sim got the most mayoral votes, all 8 NPA candidates were in the top 10 for council votes — and Adriane Carr got more votes than anyone else, including Sim.
So there’s that.
4. What’s up with Renfrew-Collingwood?
That’s pretty much all that stuck out to me. The voting patters you would expect stayed pretty much true to form … but something quirky happened in Renfrew-Collingwood — i.e., “the part of far east Vancouver that isn’t hipster but isn’t suburb either”.
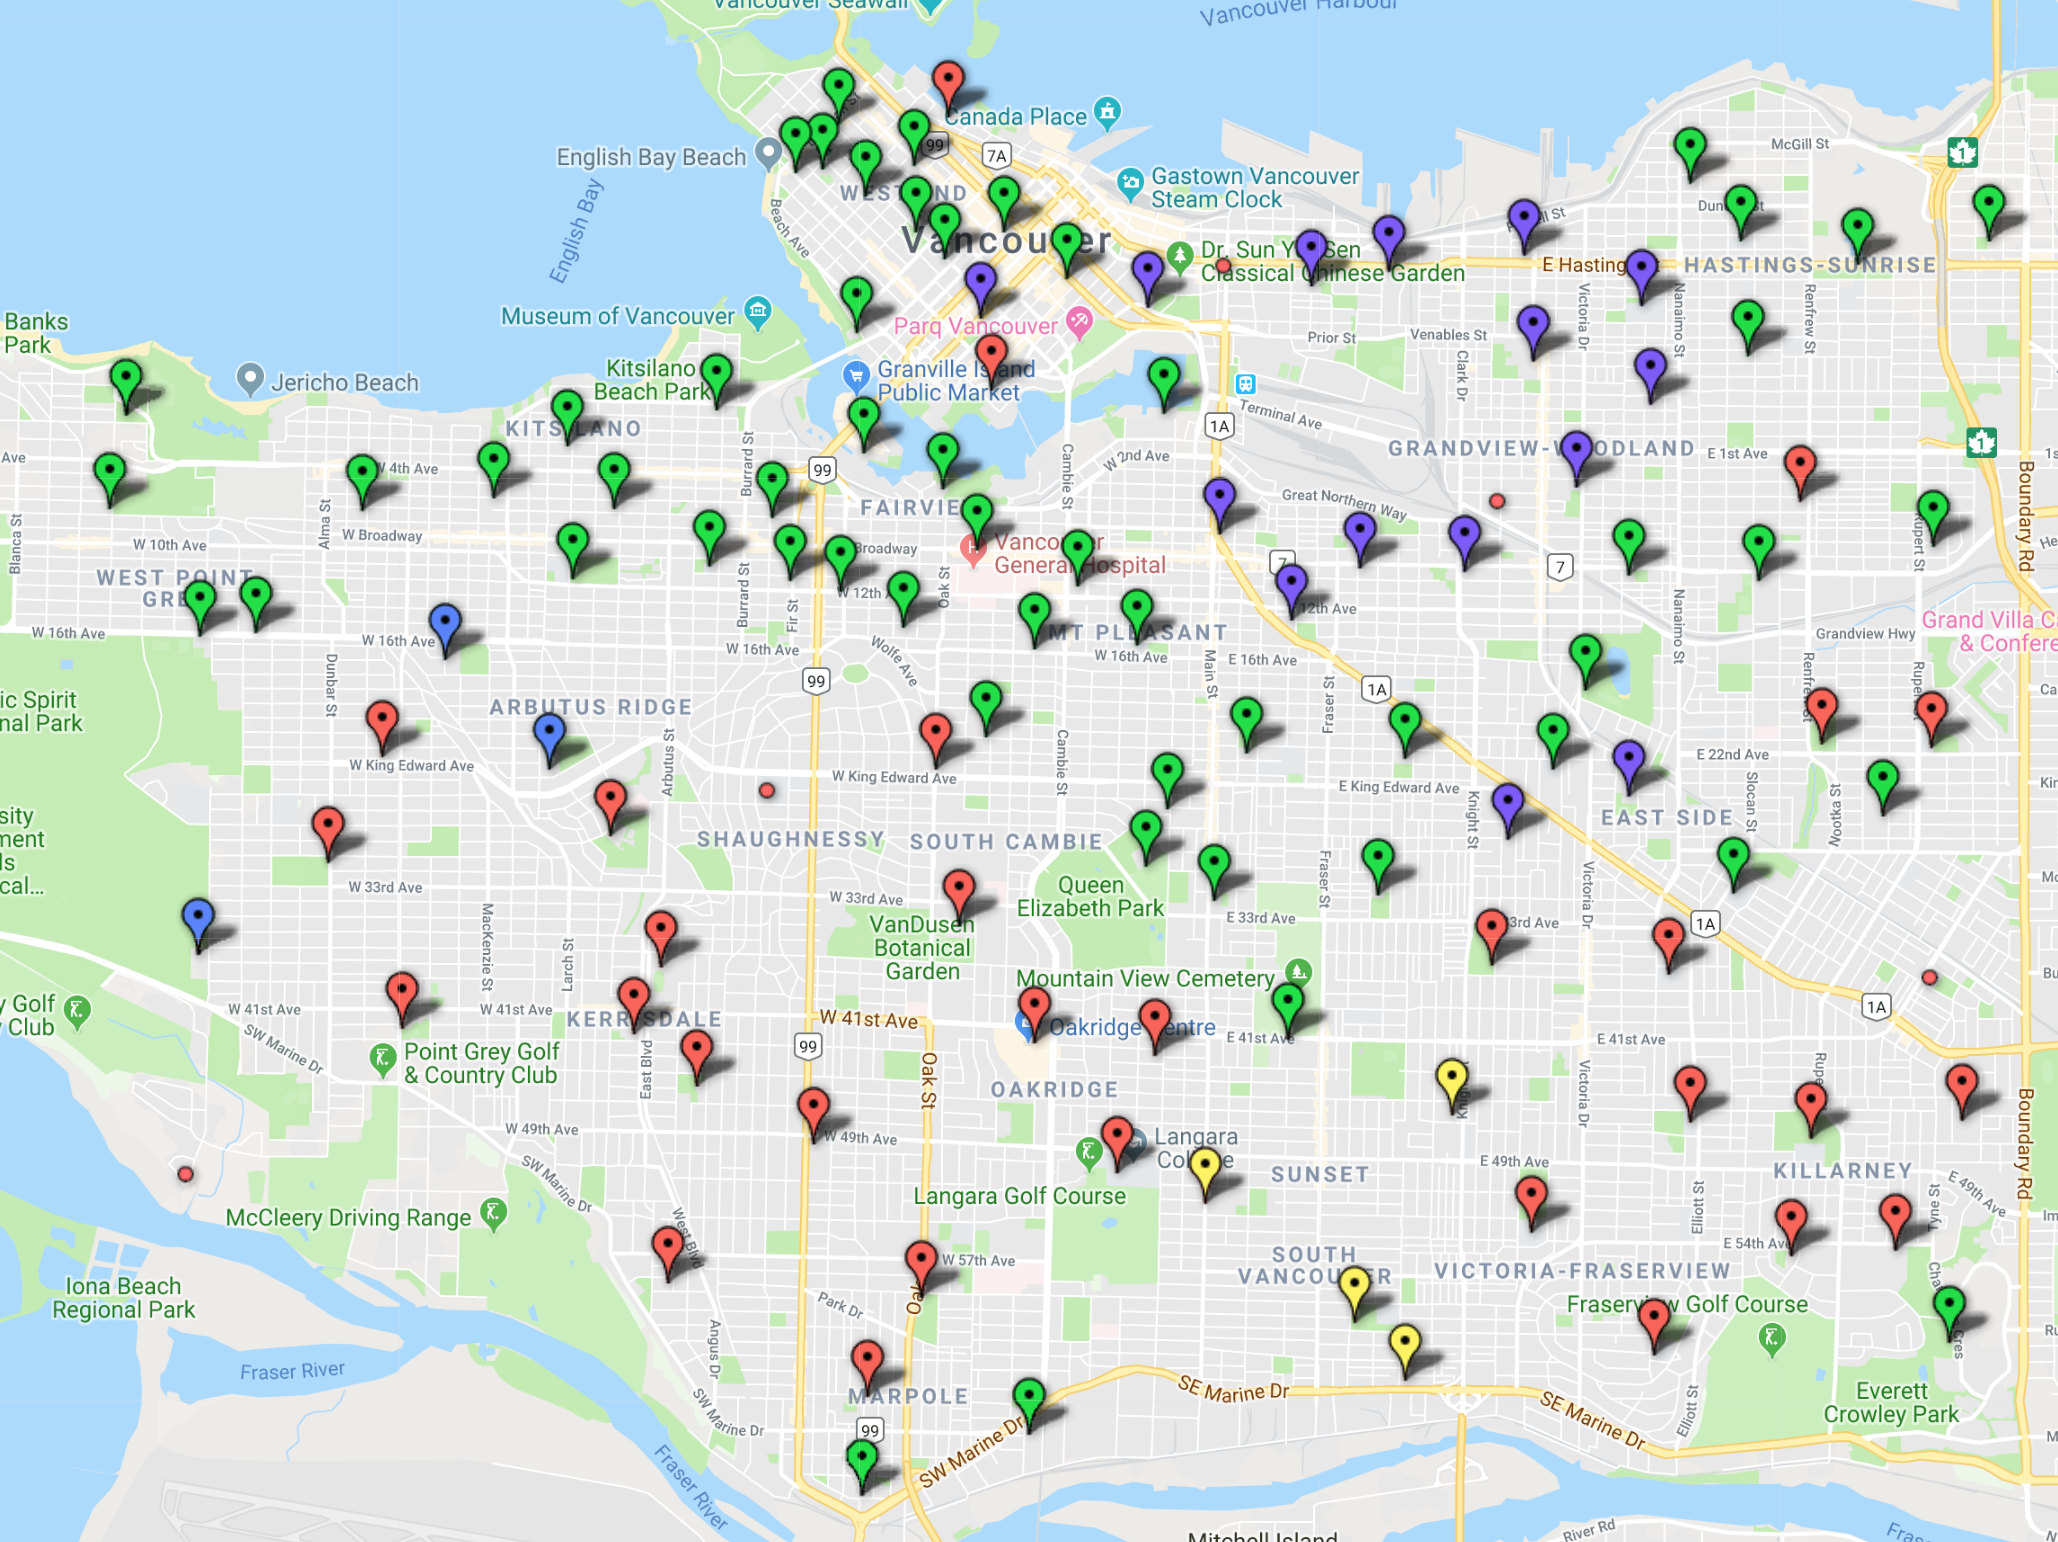
Siri, show me “polling stations where the NPA weren’t a majority of people in the top 10, but neither were the Greens+COPE”.
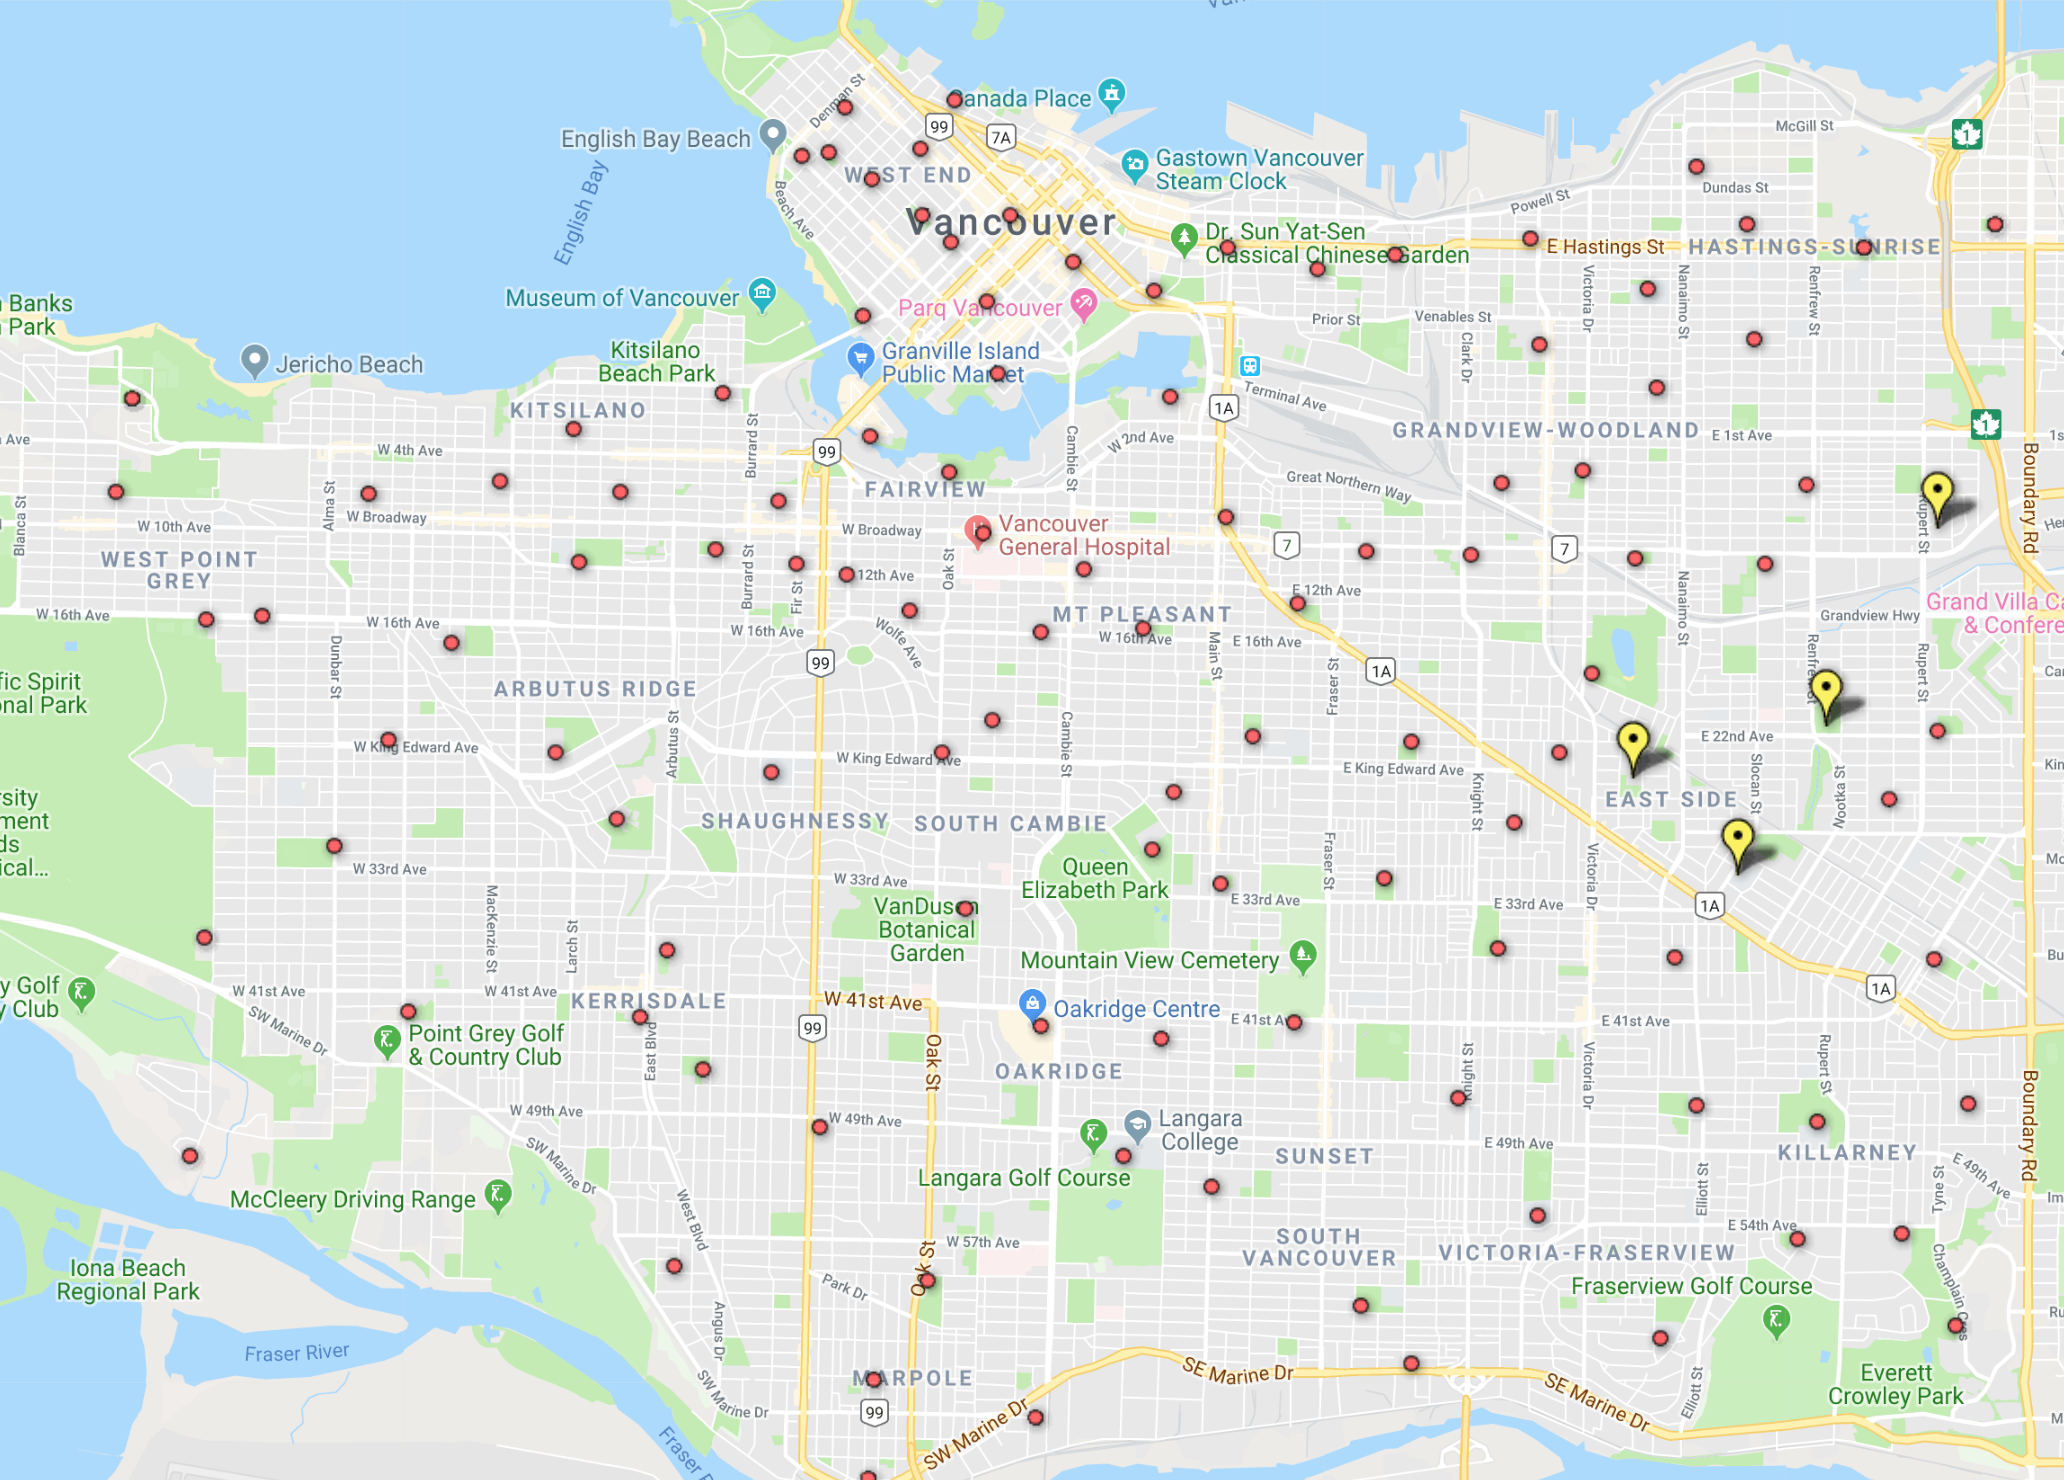
The common denominator here was Ken Low of Vancouver 1st and independent Erin Shum — both did very well in Renfrew-Collingwood, while the neighbourhood itself was fairly balanced politically, so this was the end result (Brandon Yan also did quite well here, as did Jojo Quimpo).
I’m not sure that’s the most interesting map to finish this post off with. But in an election where the results from most polling stations were pretty easy to categorize, there are still some areas that defy easy description.

There was an extended period of advanced polling – where people like me (out of town on election day) could vote, but not exactly at our nearest polling station. More than 48,000 people cast a ballot over seven days of early voting.
Would that change any of your conclusions or does it not matter in the slightest?
where did you get the polling station data from to write this blog post?